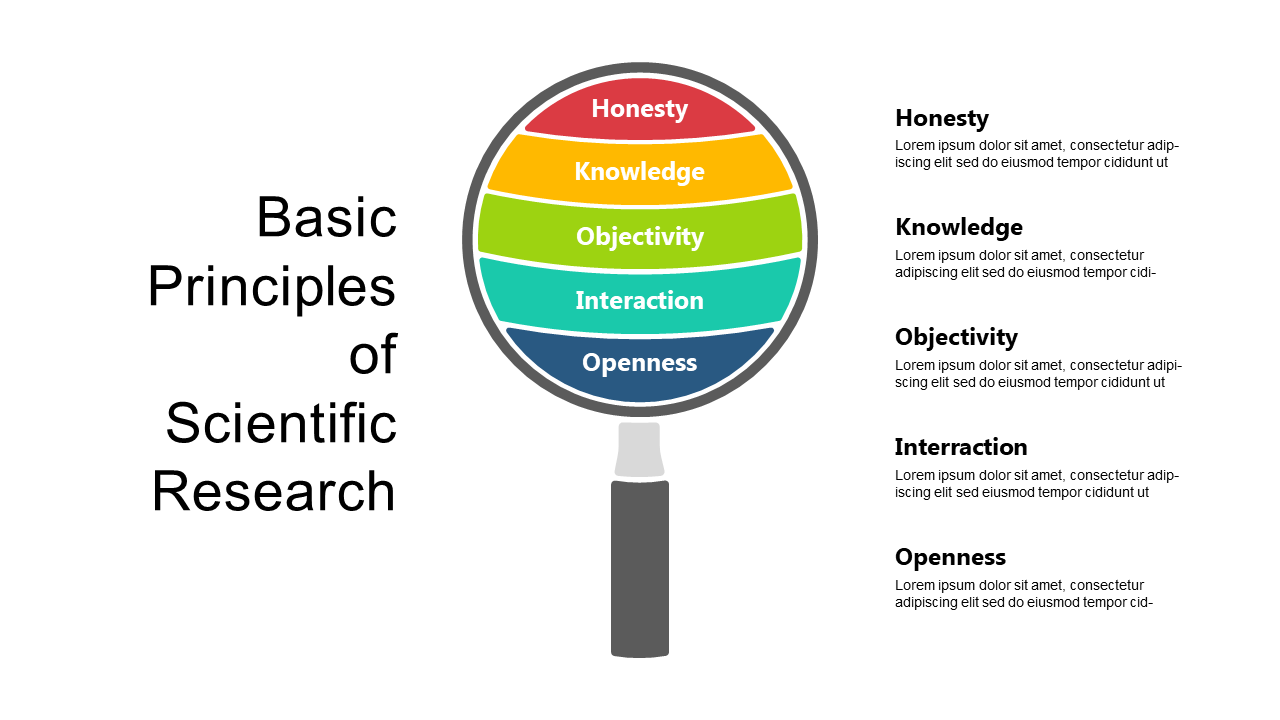
Explore Scientific Research Principles with Magnifying Glass
Product Description
Explaining the principles of scientific research can feel daunting, especially when trying to make the content accessible to various audiences. With the magnifying glass layout, you can spotlight key research principles, simplifying complex ideas into clear, concise points that everyone can grasp.
It’s a valuable tool for enhancing understanding in your presentations. Educators can use this slide for lectures on scientific methodology, researchers can incorporate it into grant proposals, and students can present their findings with confidence. It supports a variety of scenarios where clarity in presenting research concepts is essential.
For just $0.99, you can download this slide and customize it easily in PowerPoint and Google Slides. It’s designed to allow you to plug in your information quickly, so you can focus on delivering your message effectively.
$0.99 – Purchase Checkout
Added to cart