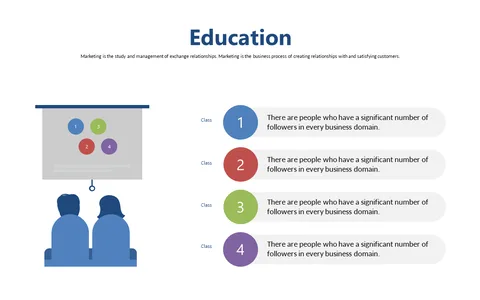
Detailed Education Overview with Class Insights
Product Description
Presenting educational insights can feel overwhelming, especially when you need to break down complex information for your class. This slide provides a straightforward way to present detailed insights that resonate with students, ensuring they grasp their academic journey.
You’ll have a clear structure that highlights important data points effortlessly. Teachers, academic advisors, and school administrators will find this slide invaluable during parent-teacher conferences, academic reviews, or any meeting focused on student performance. Use it to illustrate class demographics, achievements, and areas needing improvement, making your presentations both informative and engaging.
For just $0.99, you can download this slide instantly and start editing it in PowerPoint or Google Slides. Customize it with your data and have it ready in no time for your next presentation.
$0.99 – Purchase Checkout
Added to cart