Showcase Processes with Layered Diagrams
Product Description
When it comes to sharing complex processes, clarity is key; otherwise, your audience risks misunderstanding essential points. A jumbled presentation can confuse viewers and dilute your message.
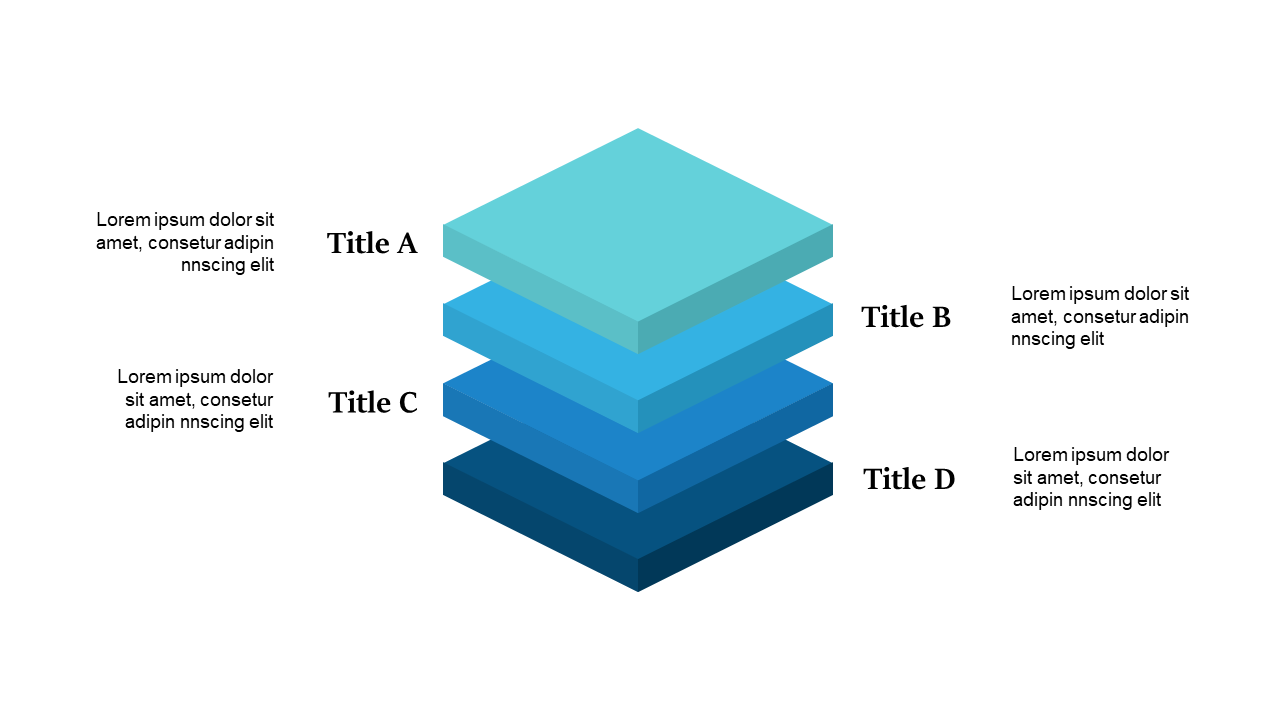
This slide’s layered diagram structure effectively organizes information, allowing you to present each stage and component in an appealing and logical way. This slide is ideally suited for business professionals like process improvement specialists, product managers, or trainers. Whether you’re outlining a new project, conducting a workshop, or delivering a status update, this visual will help your audience grasp the critical elements without losing sight of the bigger picture.
For just $0.99, you can download this slide instantly and edit it easily in PowerPoint or Google Slides. Make your presentations shine with clear visuals that enhance understanding and retention.
$0.99 – Purchase Checkout
Added to cart