Showcase Customer Journey Metrics with Funnels

Product Description
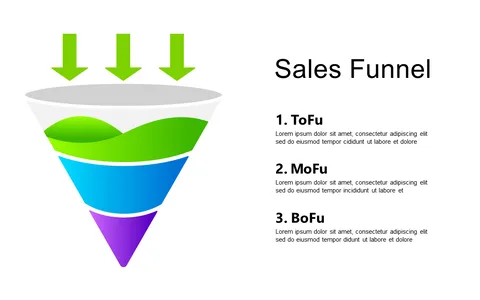
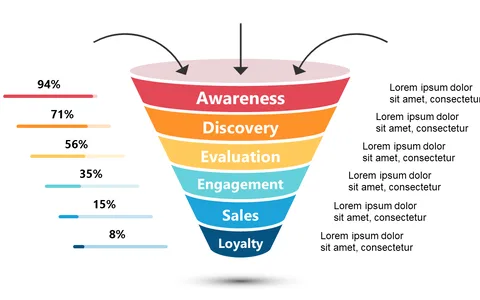
Communicating the customer journey metrics effectively can be a daunting task when trying to convey both data and insight. A typical presentation may not do justice to the complexities of customer engagement. This funnel diagram visually breaks down the customer journey into three sections, enhancing your ability to discuss and analyze important metrics with clarity.
Customer success managers, marketing specialists, and business analysts will find this slide particularly helpful during workshops or strategy sessions. Use it to illustrate how customer interactions evolve through the funnel stages, helping your team pinpoint areas of success and opportunities for improvement.
This visual approach makes it easier for everyone to follow along and engage in meaningful discussions. For only $0.99, you can download this slide instantly, and it’s ready for editing in PowerPoint or Google Slides. With customizable options to match your branding and content, you’ll have everything set for your presentation in just a few minutes.
$0.99 – Purchase Checkout
Added to cart