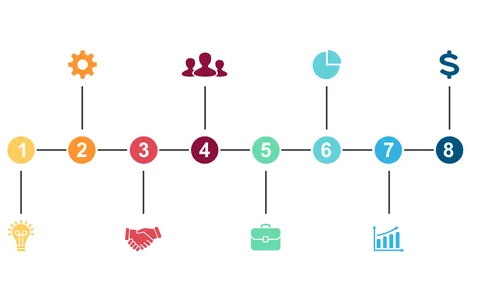
Visualize Processes with Stacked Layered Diagram

Product Description
Communicating multi-step processes can often leave your audience overwhelmed or disengaged. If you find it difficult to represent complex workflows clearly, you need a visual tool that speaks for itself. A stacked layered diagram allows you to break down information into manageable parts, guiding your audience through the process effortlessly.
This slide is ideal for business analysts presenting workflow changes, engineers explaining project phases, or marketing teams illustrating customer journey maps. By using this diagram, you can clearly depict each step, making it easier for everyone involved to understand the entire process from start to finish.
Available for only $0.99, this slide is an instant download that
you can customize in both PowerPoint and Google Slides. Editing colors and icons is a breeze, so you can tailor it to match your specific needs and make a lasting impression in just minutes.
$0.99 – Purchase Checkout
Added to cart