Summarize Business Themes with Circular Icon Set

Product Description
Capturing complex business themes can feel overwhelming, especially when you’re trying to keep your audience engaged. Relying solely on text can lead to information overload, making it hard for your listeners to grasp your key points.
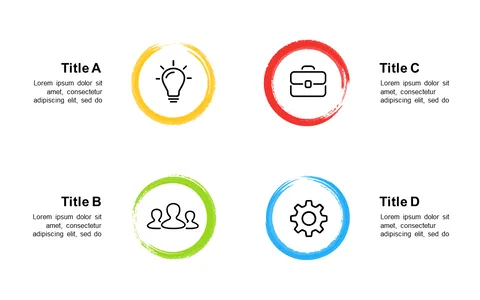
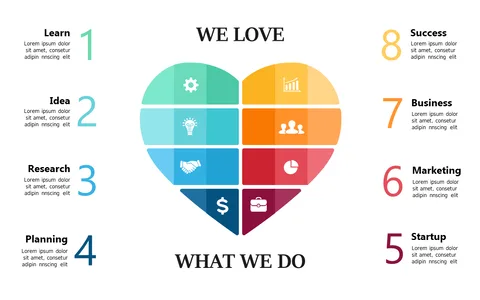
A visual approach, like this circular icon set, offers an effective way to break down and summarize those concepts clearly. This slide is perfect for marketing managers presenting brand strategies, project coordinators sharing updates in team meetings, or financial analysts outlining economic trends. Each circular icon makes it easy to illustrate different themes such as innovation or productivity, ensuring your audience stays engaged and informed throughout your presentation.
For just $0.99, you can instantly download this slide, which is fully editable in PowerPoint and Google Slides. Customize the icons and colors to fit your needs, and you’ll have a polished visual aid ready to go in minutes.
$0.99 – Purchase Checkout
Added to cart