Showcase Workflows with Circle Icon Steps

Product Description
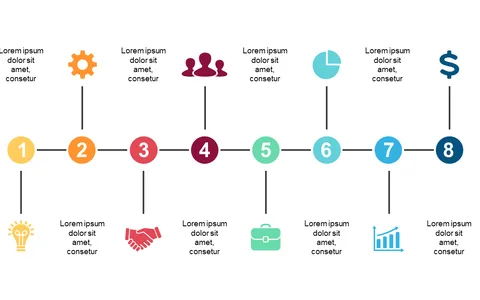
Tired of your audience zoning out during presentations about business processes? This slide helps you break down workflows into digestible pieces with connected circle icons, making it easier for everyone to follow along.
Marketing managers and operations specialists can use this slide to clarify campaign processes or project workflows during strategic meetings. It’s also ideal for team collaborations and training sessions, allowing you to clearly outline each step and its significance.
Available for just $0.99, this slide is ready for instant download and fully editable in PowerPoint and Google Slides. You can personalize it in no time, ensuring your presentation is both informative and engaging.
$0.99 – Purchase Checkout
Added to cart