Puzzle Pieces Framework for Financial Success

Product Description
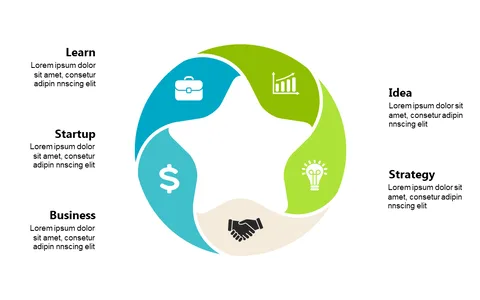
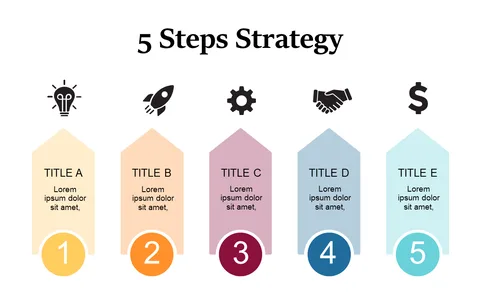
Struggling to visualize how different components of your business strategy contribute to financial success? This slide offers a clear way to illustrate the connections between essential elements like teamwork, planning, and profit using an eye-catching puzzle piece layout.
This format is perfect for finance managers, business development professionals, and project leaders during strategy briefings or budgeting sessions. Whether you’re aiming to align teams around a financial goal or presenting to a group of potential investors, this slide will help you deliver your message with clarity.
Available for immediate download at just $0.99, this slide is easy to edit in PowerPoint and Google Slides. You’ll have a professional-quality visual that enhances your presentation in no time.
$0.99 – Purchase Checkout
Added to cart