Engage with Puzzle Pieces Profit Strategy Framework

Product Description
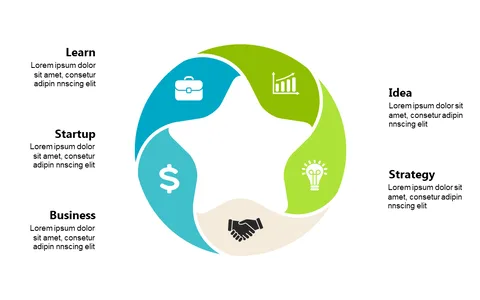
When it comes to strategy consulting, finding effective ways to communicate complex interdependencies in your business strategy can be challenging. This slide provides a visually engaging way to showcase how various elements fit together, utilizing a compelling puzzle piece design that highlights the dollar sign, symbolizing profit.
Perfect for consultants, business strategists, and financial analysts, this slide works well in meetings where you’re discussing market approaches, investment strategies, or operational efficiencies. Whether you’re presenting to a board of directors or leading a team workshop, this slide can help you convey your key ideas clearly and effectively.
You can download this slide for just $0.99, and it’s fully editable in both PowerPoint and Google Slides. With just a few clicks, you’ll have a polished visual ready to enhance your presentation in minutes.
$0.99 – Purchase Checkout
Added to cart