Visualize Project Phases with Circular Process Diagram
Product Description
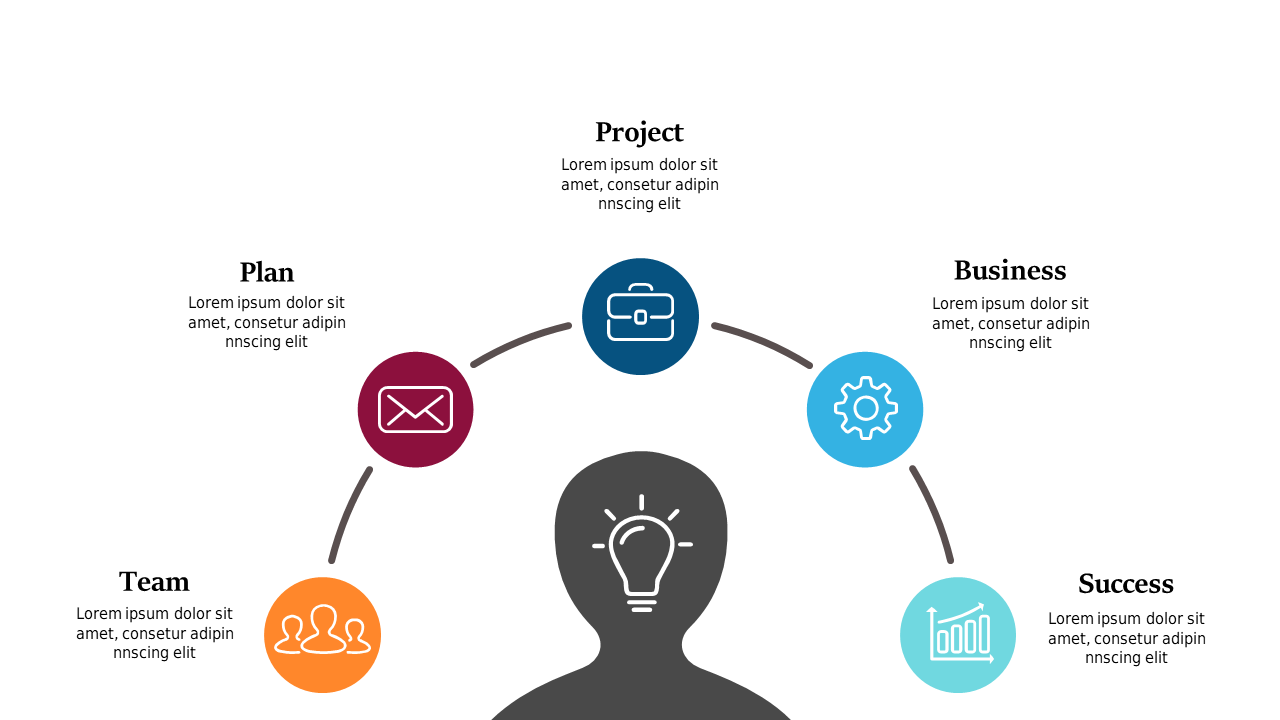
Visualizing project phases can sometimes feel overwhelming, especially when trying to convey multiple elements in a coherent way. This circular process diagram simplifies that complexity, making it easier for your audience to understand how different stages connect.
By featuring components like Project, Plan, Business, Team, and Success, you can present a clear roadmap of your project. This slide is a great asset for project managers, team leads, and department heads during strategy sessions, project launches, or team workshops. It works well across various industries, including IT, manufacturing, or marketing, helping you share your project vision with clarity.
Available for just $0.99, you can download this slide instantly and customize it to fit your needs. It’s fully editable in PowerPoint and Google Slides, offering you the flexibility to make it uniquely yours.
$0.99 – Purchase Checkout
Added to cart







