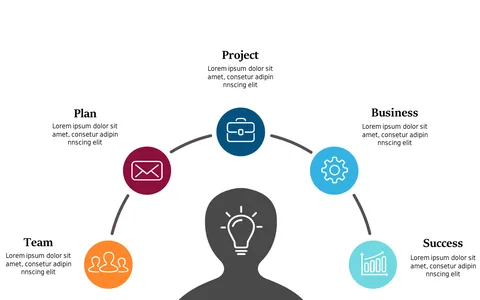
Visualize Team Success with Circular Process Diagram

Product Description
In the busy world of project management, articulating the success of your team can be tricky without the right visuals. You need a straightforward way to showcase workflow and accomplishments, and this circular process diagram makes that possible.
It clearly outlines how each component contributes to your team’s success, making it a must-have for presentations. Ideal for project managers presenting to upper management, team leaders reporting outcomes to clients, or consultants demonstrating process effectiveness, this slide fits seamlessly into various scenarios. You’ll find it transforms complex project data into an easily understandable format that resonates with your audience.
For just $0.99, this diagram is ready for instant download to enhance your presentations. Edit it easily in PowerPoint and Google Slides, allowing you to customize it quickly to match your project’s specifics.
$0.99 – Purchase Checkout
Added to cart