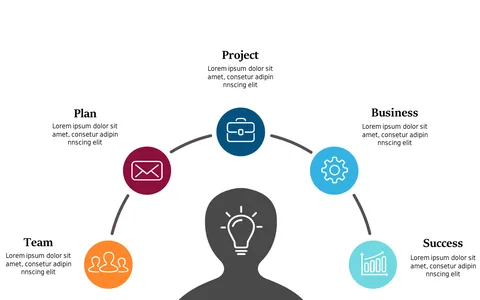
Showcase Project Stages with Circular Process Diagram
Product Description
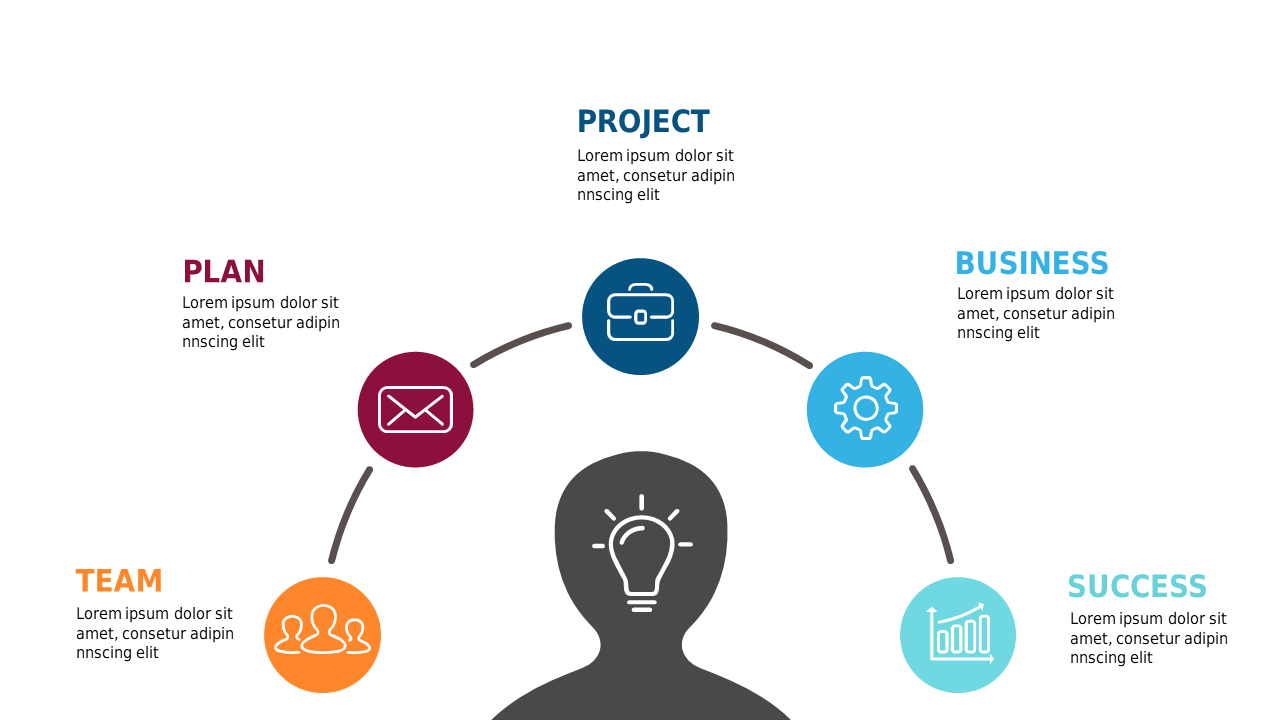
As a project manager, juggling multiple stages can feel overwhelming, especially when trying to convey each phase to your team. Clear visuals can make a huge difference in ensuring everyone understands their roles, and this circular process diagram helps you achieve that clarity.
It’s designed to highlight each stage in a way that’s easy to digest. This slide is ideal for project coordinators managing timelines, team leaders preparing for status updates, or anyone presenting a project in a client meeting. Visual aids like this can significantly enhance understanding, leading to smoother collaboration and execution.
For only $0.99, you can download this handy visual tool that’s ready for your immediate use. It’s easy to edit in PowerPoint or Google Slides, allowing you to tailor it to your specific project needs in just minutes.
$0.99 – Purchase Checkout
Added to cart