Pyramid Diagram for Sustainability Concepts
Product Description
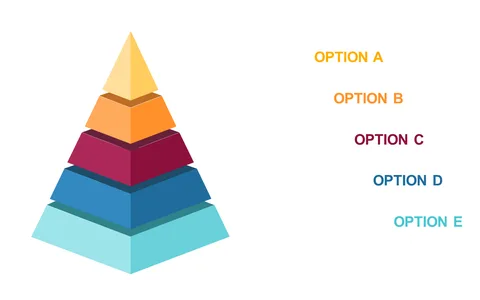
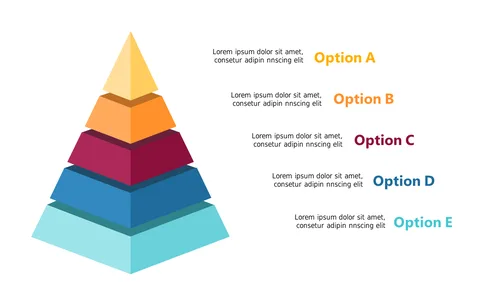
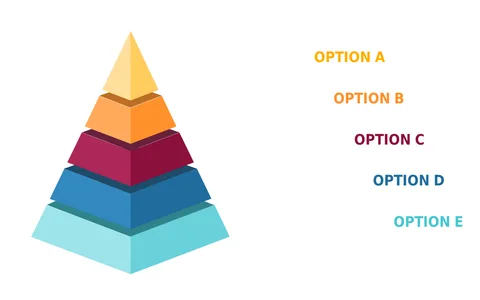
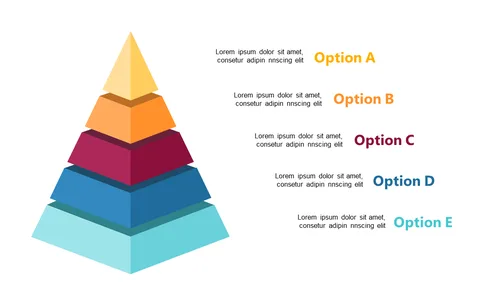
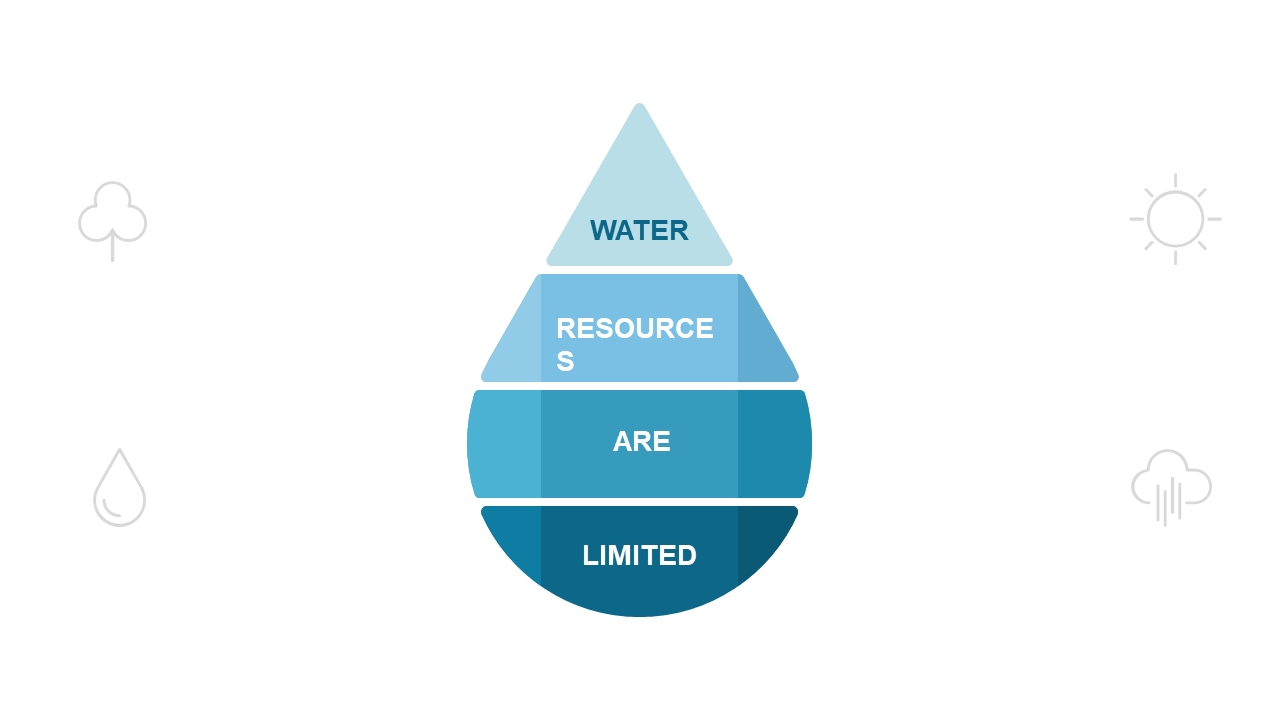
Communicating sustainability concepts can be challenging, but this pyramid diagram helps you break down the information effectively. It organizes key ideas and emphasizes their relationships, allowing your audience to see the big picture without losing sight of the details.
This slide is particularly effective for educators discussing environmental topics in lectures or corporate trainers addressing sustainability practices during workshops. It can also support project managers outlining eco-friendly initiatives or strategic planning sessions focused on environmental impact.
Available for just $0.99, this slide is an instant download that you can edit in PowerPoint or Google Slides. Customizing it for your presentation needs is quick and easy, so you can make a lasting impression in no time.
$0.99 – Purchase Checkout
Added to cart