Present Chronological Events with Colorful Timeline
Product Description
Crafting a clear and engaging presentation of project timelines is essential, yet it can be challenging to communicate milestones effectively. Your audience deserves to understand the flow of events without being bogged down in details.
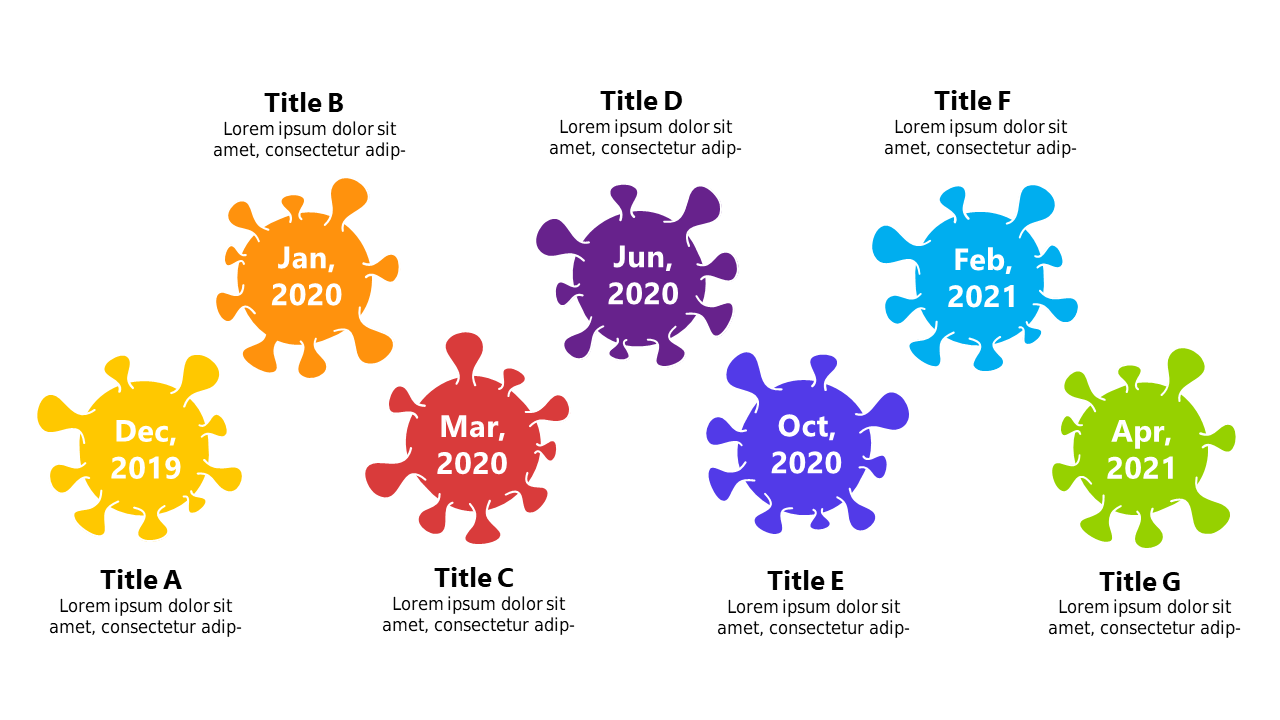
This colorful timeline slide serves as a dynamic way to present chronological events that captivate attention. Project managers, event coordinators, or anyone involved in timeline planning can leverage this slide during project kickoff meetings, status updates, or retrospective discussions. The distinct date markers and titles help ensure that your audience remains engaged and clearly understands the project’s progression.
Available for only $0.99, this slide is ready for instant download and can be edited in both PowerPoint and Google Slides with ease. Customize it quickly to fit your project’s specifics and make a lasting impression.
$0.99 – Purchase Checkout
Added to cart