Present Tech Concepts with Isometric Layout

Product Description
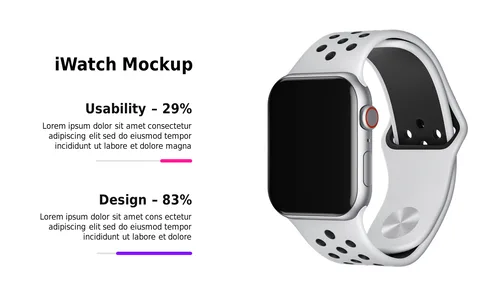
Trying to explain intricate tech concepts can sometimes leave your audience lost in technical jargon. It’s crucial to present these ideas clearly and engagingly, and this isometric layout is your answer. It allows you to blend visuals with important information, making it easier for your audience to grasp complex subjects quickly.
This slide is ideal for software developers presenting project updates to stakeholders or IT consultants explaining system enhancements during client meetings. Whether you’re in a classroom setting or a corporate boardroom, this slide aids in making your tech concepts understandable and memorable. Its visual flair is perfect for any tech-focused discussion.
For just $0.99, you can download this slide and make it your own. It’s ready for immediate use and can be customized in PowerPoint or Google Slides with just a few clicks. Don’t miss out on this opportunity to enhance your presentations with a professional touch.
$0.99 – Purchase Checkout
Added to cart