Show Usability Metrics with iWatch Mockup
Product Description
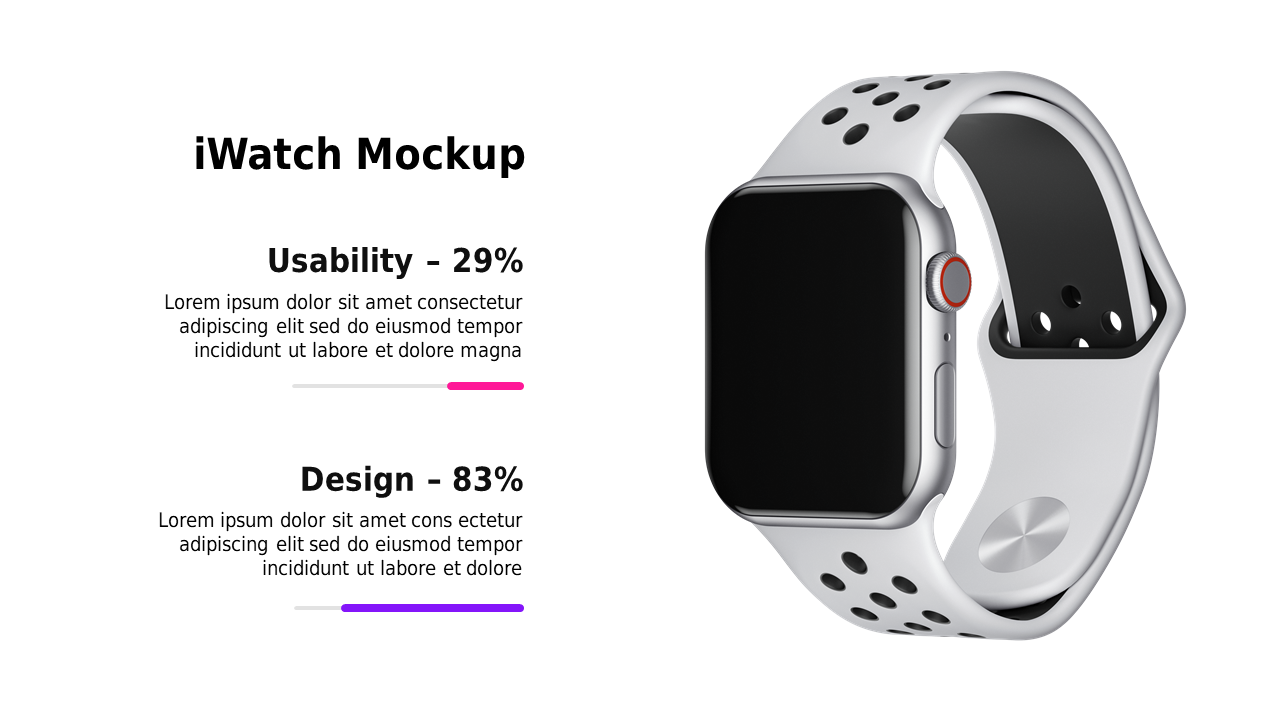
Communicating usability metrics effectively can be tricky, especially when you want to present both data and design cohesively. This slide features an iWatch mockup alongside key performance metrics, making it easy to convey the relationship between usability and design at a glance.
Ideal for tech presentations, design reviews, or marketing strategy meetings, this slide is a great fit for product managers, UX/UI designers, and marketing coordinators. You can adapt it to showcase specific metrics, emphasizing the aspects that matter most to your audience.
For just $0.99, this slide is ready for instant download and comes fully editable in PowerPoint and Google Slides.
You can customize it to suit your needs and have it ready for your next meeting in minutes.
$0.99 – Purchase Checkout
Added to cart