Illustrate Concepts with Venn Diagram V3
Product Description
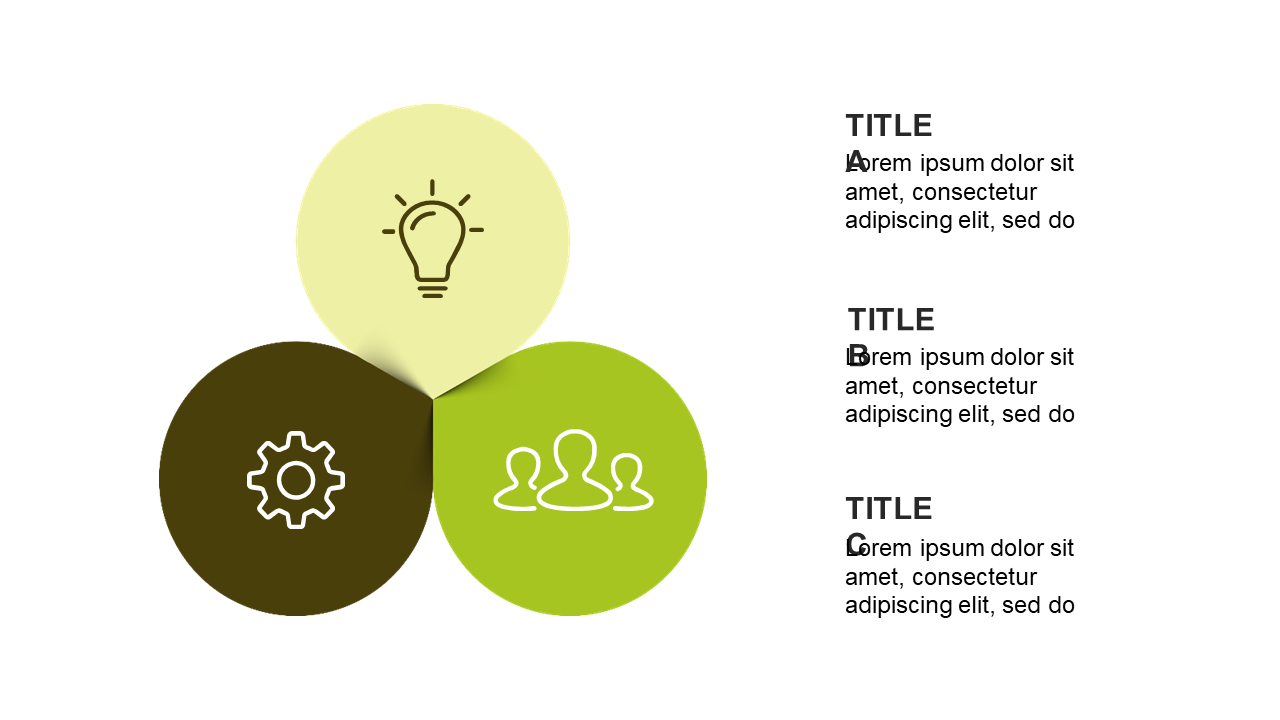
Simplifying the explanation of interconnected concepts often feels impossible, especially in meetings filled with details. A well-crafted Venn diagram can help you illustrate those connections clearly, making it easier for your audience to grasp complex information.
It’s all about showing how distinct ideas overlap and relate to one another. This slide is perfect for educators outlining curriculum overlaps or product managers explaining how different projects share resources. If you’re in a consulting role and need to illustrate competitive advantages or market overlaps, this diagram makes your points visually compelling and easily digestible.
At just $0.99, this slide is an instant download that you can modify within minutes. It’s ready for use in both PowerPoint and Google Slides, giving you the flexibility to tailor it to your presentation style without losing time.
$0.99 – Purchase Checkout
Added to cart







