Effective Comparative Analysis with Venn Diagram
Product Description
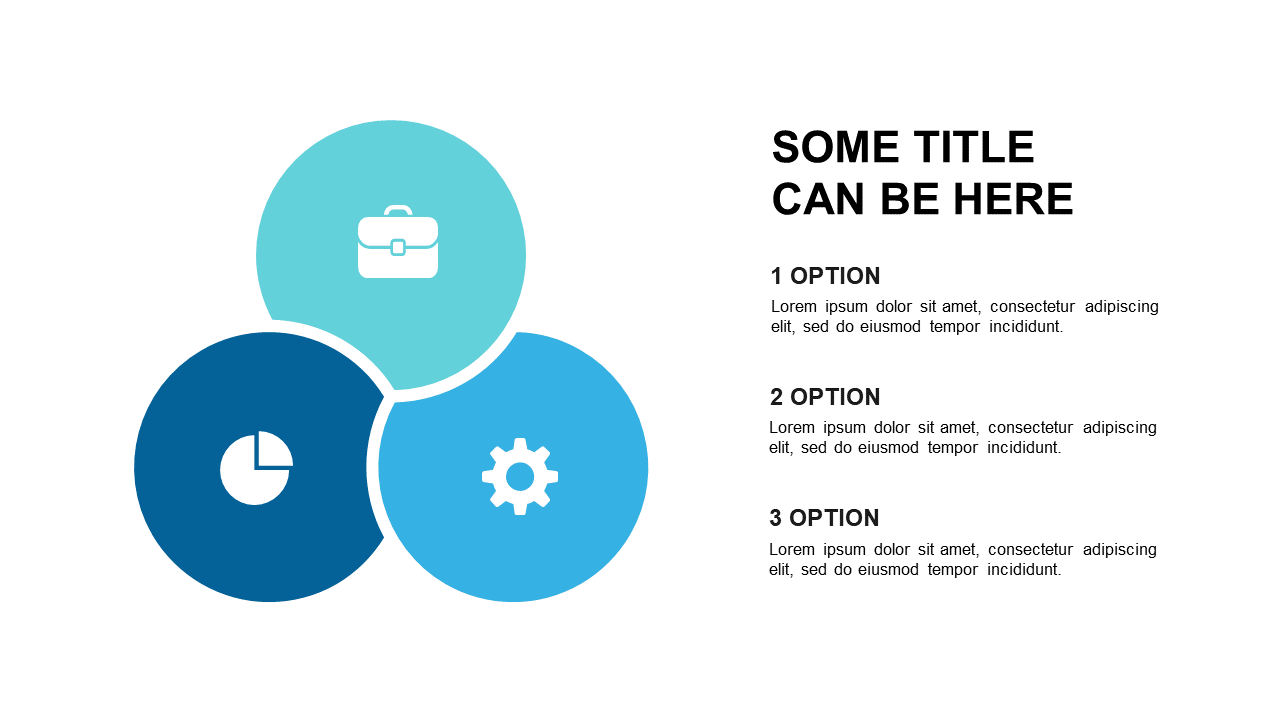
When you need to compare different concepts or brainstorm ideas, a standard slide might not cut it. This Venn diagram is designed to illustrate relationships clearly, helping your audience visualize overlaps and distinctions effectively. It turns abstract comparisons into tangible insights.
This slide works wonders for product managers evaluating features or marketing teams discussing competitive analysis. It’s perfect for workshops or meetings where you need to foster discussion and clarity about how different elements relate to one another.
It encourages collaboration and drives insightful conversations. For just $0.99, you can instantly download this Venn diagram and tailor it for your needs. It’s easy to edit in both PowerPoint and Google Slides, allowing you to swap out icons and text quickly to keep your information relevant and engaging.
$0.99 – Purchase Checkout
Added to cart







