Present Strategies with 8-Segment Circular Diagram V2
Product Description
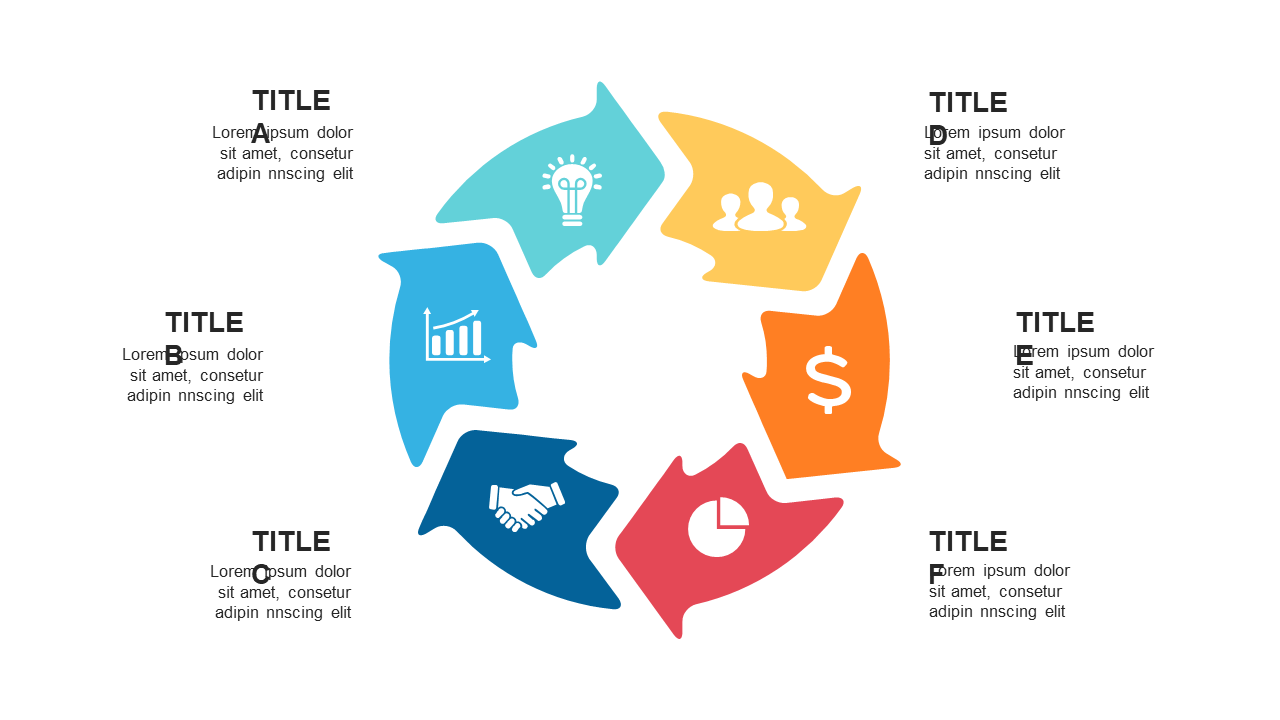
Explaining the steps involved in a strategy can quickly become convoluted without the right visual aids. This 8-segment circular diagram simplifies the communication of cyclical processes, making it easier for your audience to follow along. It’s designed to keep your presentation focused and visually engaging.
Use this slide in team strategy sessions, executive briefings, or project management reviews. It’s particularly effective for business analysts presenting phased approaches or consultants sharing strategic recommendations.
Clear visuals help reinforce your message and keep everyone aligned. Available for only $0.99, this slide can be downloaded instantly and is fully editable in PowerPoint and Google Slides. Customize it with just a few clicks to match your presentation style, ensuring you’re always ready to deliver a polished performance.
$0.99 – Purchase Checkout
Added to cart







