Enhance Strategy Presentations with Quadrant Diagram V2
Product Description
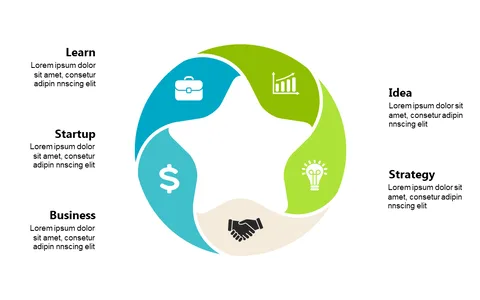
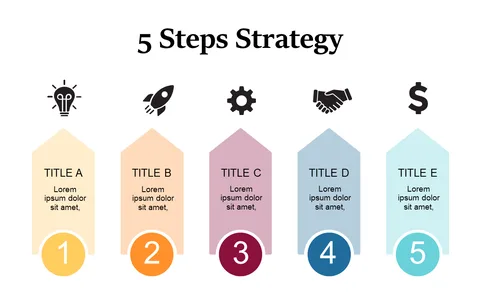
Making strategic decisions requires clear visualization of core concepts, and that can often be challenging. This second version of the quadrant diagram helps you present your ideas in a straightforward format, making it easier for your audience to grasp and remember essential points.
Consider using this slide in a seminar as a business coach or in a planning session as a product manager. It’s an excellent choice for strategy meetings or project kick-offs where you need to map out objectives while keeping your team engaged and aligned.
You can grab this slide for only $0.99 and start using it instantly. It’s designed for quick editing in both PowerPoint and Google Slides, so you can tailor it to fit your unique presentation needs in just a few minutes.
$0.99 – Purchase Checkout
Added to cart