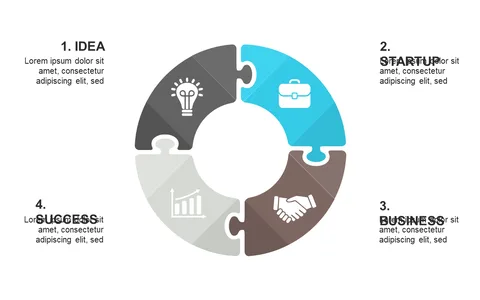
Customize Circular Process Diagram for Presentations

Product Description
Presenting complex ideas in a clear manner can be a significant hurdle during meetings or conferences. You need a visual tool that not only captures your audience’s attention but also conveys your points in an understandable way.
This circular process diagram is the perfect solution, breaking down intricate processes into manageable segments adorned with intuitive icons. Whether you’re a product manager running sprint reviews, a business analyst discussing workflow optimizations, or a trainer leading workshops, this diagram can effectively enhance your presentations. It’s especially useful in scenarios where explaining multi-step processes is crucial, such as strategy meetings or educational sessions.
At just $0.99, you can quickly download this slide and make it your own. It’s easy to edit in both PowerPoint and Google Slides, ensuring you can adapt it to fit your specific communication needs in no time.
$0.99 – Purchase Checkout
Added to cart