Present Strategic Workflows with 6-Segment Diagram
Product Description
When presenting workflows, clarity is essential to avoid misunderstandings that can derail projects. A structured visual can transform complex processes into something that’s easy to follow and engaging.
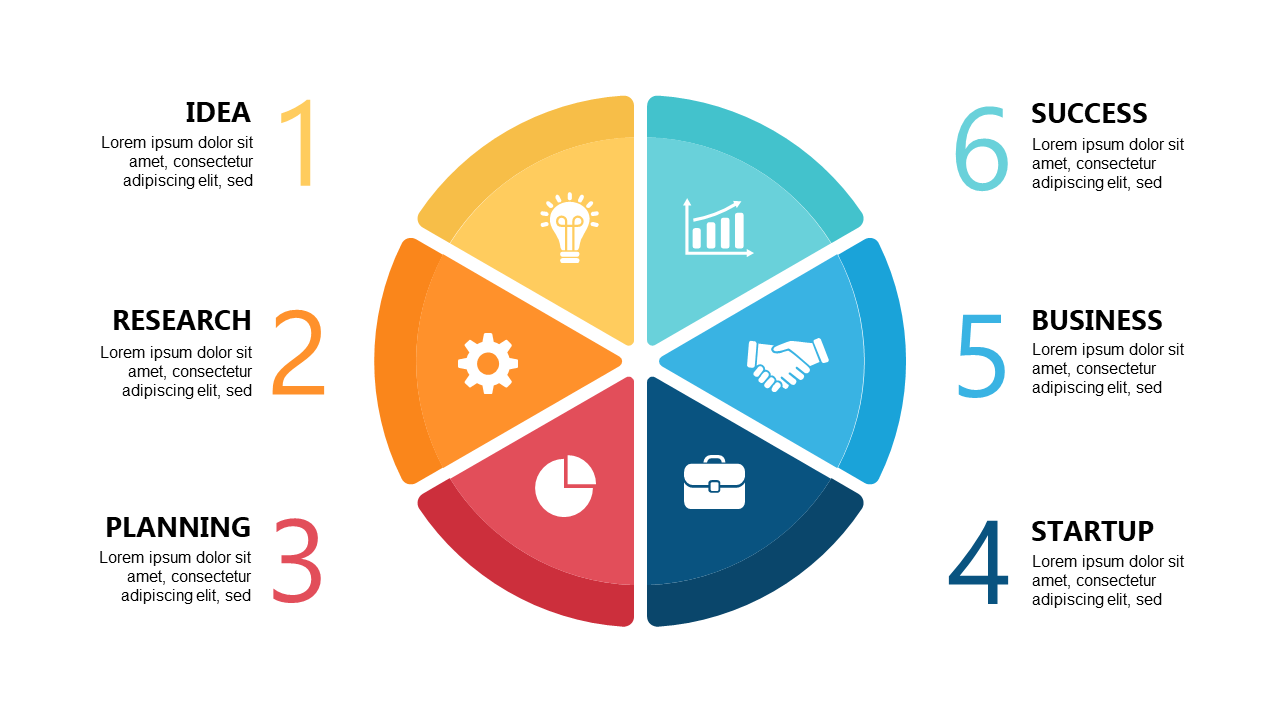
This colorful six-segment diagram serves that purpose by outlining each critical step in your strategic workflow. Business analysts, project coordinators, and marketing strategists can use this slide in staff meetings, strategic planning sessions, or client presentations. It provides a clear framework for discussing initiatives, making it easier to align your team on goals and expected outcomes.
At just $0.99, this slide is available for instant download and can be directly edited in PowerPoint or Google Slides. You’ll have a polished visual ready to go in minutes, allowing for more impactful discussions.
$0.99 – Purchase Checkout
Added to cart







