Visualize Team Dynamics with Circular 4-Part Diagram
Product Description
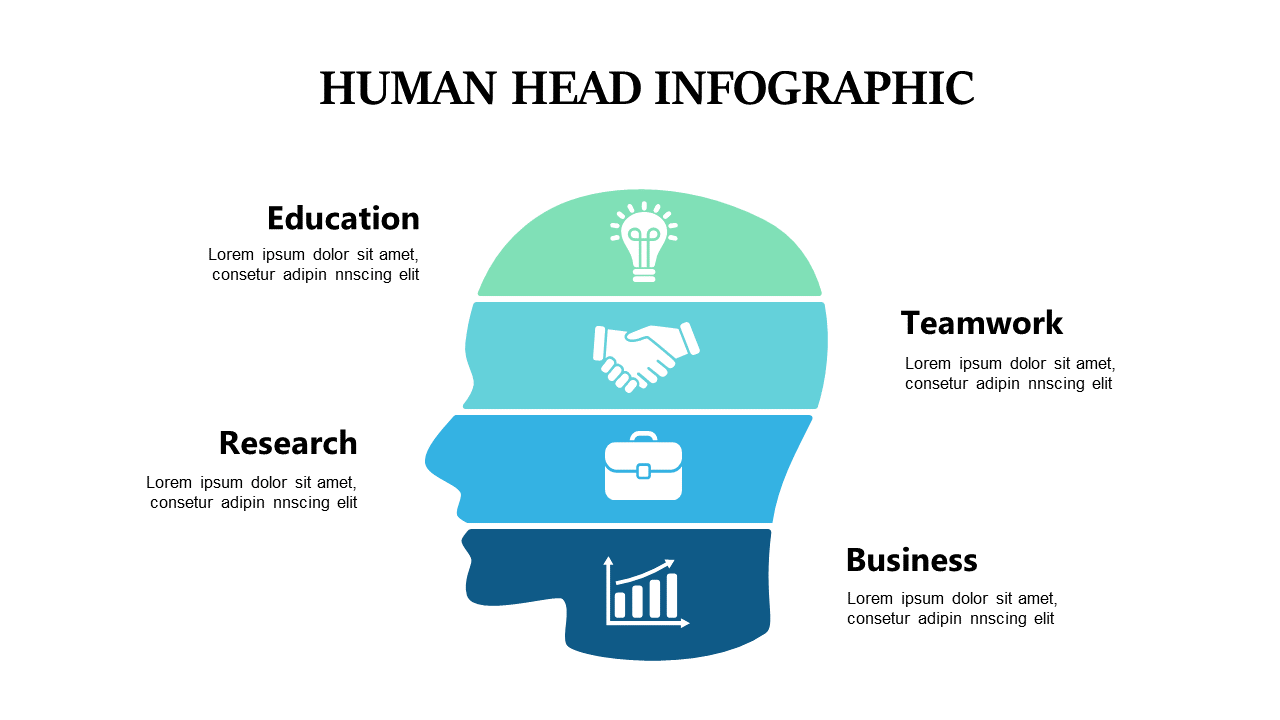
Understanding team dynamics can often feel like piecing together a puzzle. When collaboration is key to success, having a clear visual representation helps you and your audience grasp the crucial elements without confusion. This circular 4-part diagram lays everything out, ensuring everyone is on the same page.
Project managers in IT and marketing frequently need to present team roles and responsibilities during kick-off meetings. Team leaders conducting performance reviews can use this slide to illustrate how different members contribute to the overall success.
It’s also perfect for HR professionals mapping out team structures and dynamics during onboarding sessions. For just $0.99, this slide is ready for instant download and can be easily edited in PowerPoint or Google Slides. Transform your presentations in minutes and make your ideas resonate with your audience.
$0.99 – Purchase Checkout
Added to cart







