Illustrate Project Processes with Circular Flow Diagram
Product Description
Understanding the stages of a project can often feel like piecing together a puzzle with missing pieces. When trying to communicate workflows, the message can get tangled in complexity, leaving your team unsure of the next steps.
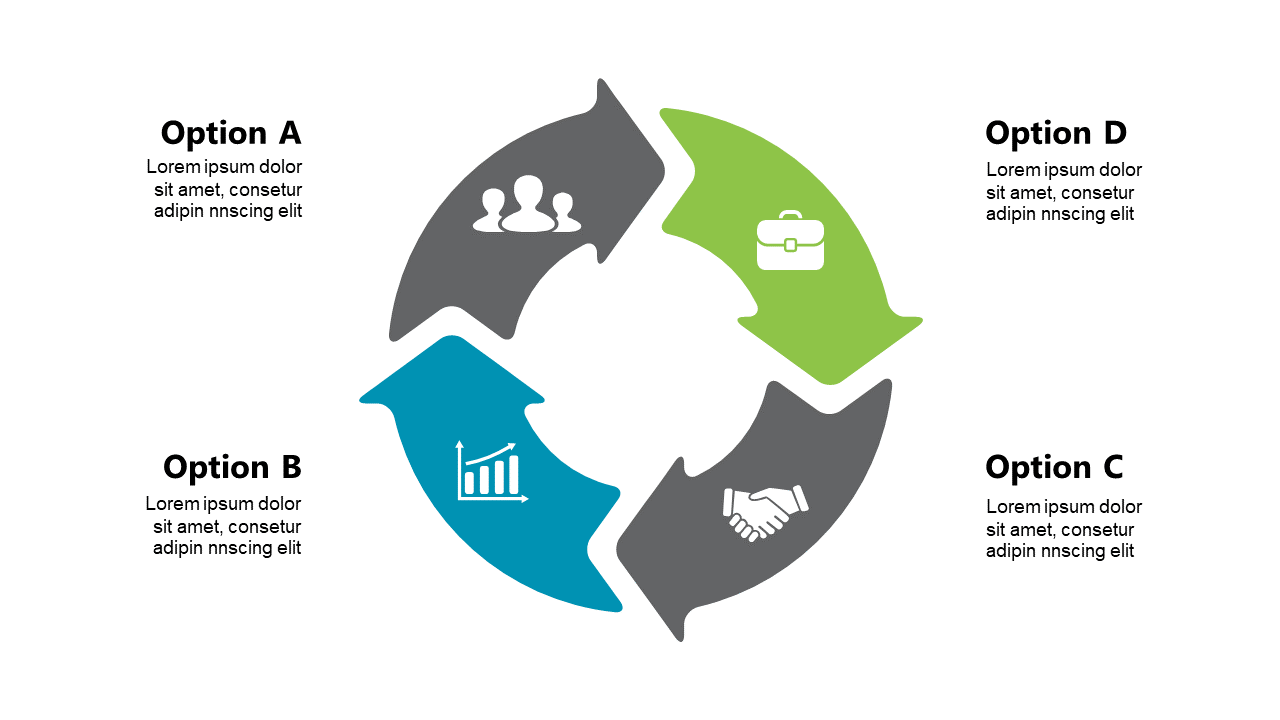
This circular flow diagram provides a clear and engaging way to illustrate each stage, ensuring that all team members are aligned. This slide is ideal for project managers detailing project phases in status meetings, software developers explaining an agile process, or team leads guiding their teams through project deliverables. It can also serve educational purposes, such as helping students comprehend project management principles in a classroom setting.
Download this slide instantly for just $0.99, and watch as it transforms your presentations. It’s easy to edit in PowerPoint and Google Slides, allowing you to tailor it to your specific project needs in no time.
$0.99 – Purchase Checkout
Added to cart







