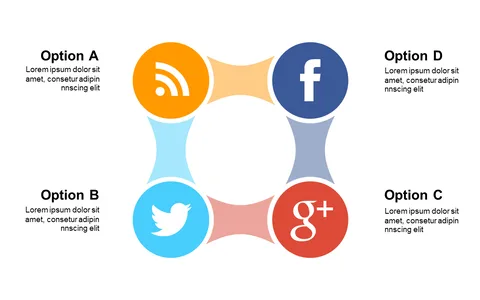
Engage with Circular Four-Quadrant Diagram Design

Product Description
When clear communication of complex ideas is essential, a visually engaging diagram can truly make a difference. This circular four-quadrant diagram simplifies information by dividing it into distinct sections, each backed by an icon.
It’s an effective way to illustrate various aspects of your topic without overwhelming your audience. This slide is particularly helpful for consultants presenting case studies, trainers leading workshops, or executives summarizing quarterly results. No matter your role, this visual will enhance your ability to engage listeners and drive your points home clearly.
Available for just $0.99, you can download this diagram instantly and edit it in PowerPoint or Google Slides with ease. You’ll have a polished presentation ready to go in no time.
$0.99 – Purchase Checkout
Added to cart