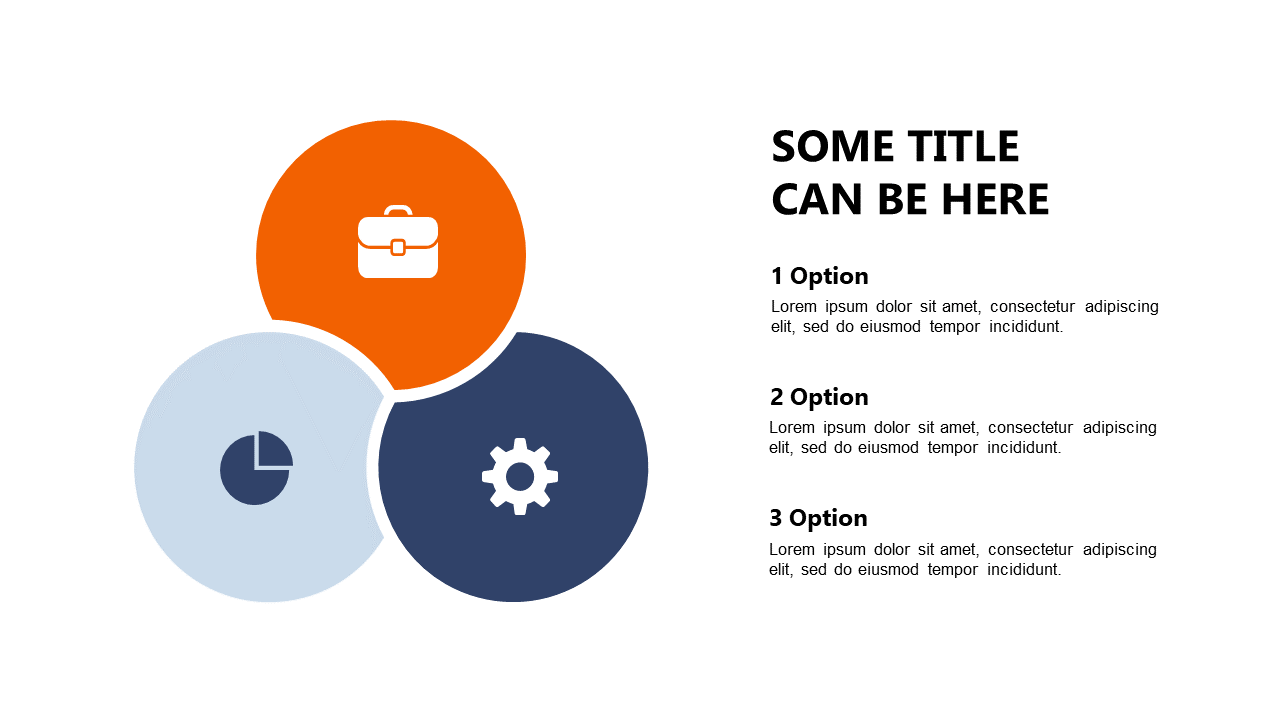
Showcase Business Relationships with Venn Diagram V4
Product Description
Presenting complex business relationships can often become convoluted if not displayed effectively. This Venn diagram simplifies those intricate connections into a clear visual format, making it much easier for your audience to understand the relationships at play.
Consider using this slide in networking presentations, during strategy development workshops, or when giving stakeholder updates. It’s perfect for business development managers, marketing strategists, or any professional needing to illustrate intersecting ideas clearly.
Available for only $0.99, this slide is ready for immediate download. You can effortlessly edit it in PowerPoint or Google Slides, tailoring it to meet your presentation needs in just moments.
$0.99 – Purchase Checkout
Added to cart