Engage Your Audience with a Colorful Circular Diagram
Product Description
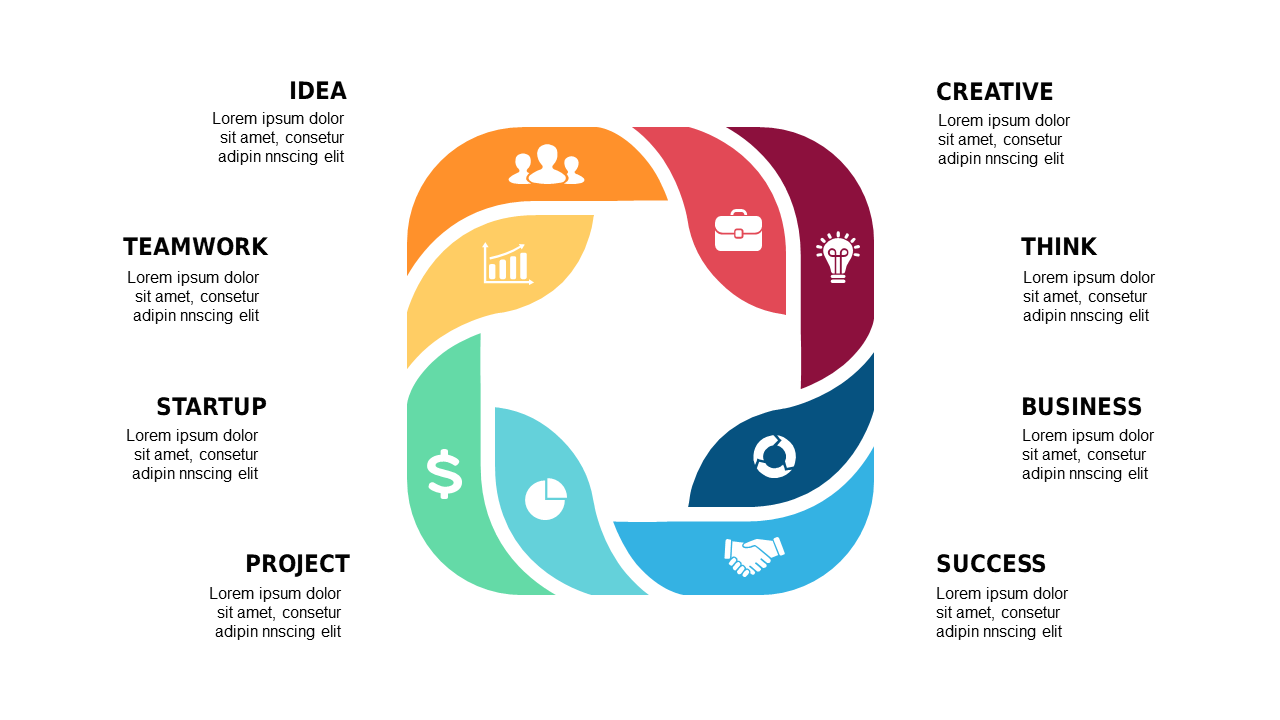
It can be tough to keep your team’s attention when you’re trying to explain complex processes. Whether you’re in a meeting or delivering a presentation, breaking down those details can feel overwhelming. This colorful circular diagram offers a refreshing way to simplify your message and keep your audience engaged.
Sales managers can use this slide during quarterly reviews to illustrate sales processes, while project managers might find it invaluable for sprint planning sessions. It’s also perfect for training sessions, helping new employees grasp essential workflows without getting lost in jargon.
For just $0.99, you can download this slide instantly and
easily customize it to fit your branding in PowerPoint or Google Slides. You’ll have it ready for your next meeting in minutes, ensuring your audience stays focused and informed.
$0.99 – Purchase Checkout
Added to cart







