Showcase Project Phases with a 6-Step Diagram
Product Description
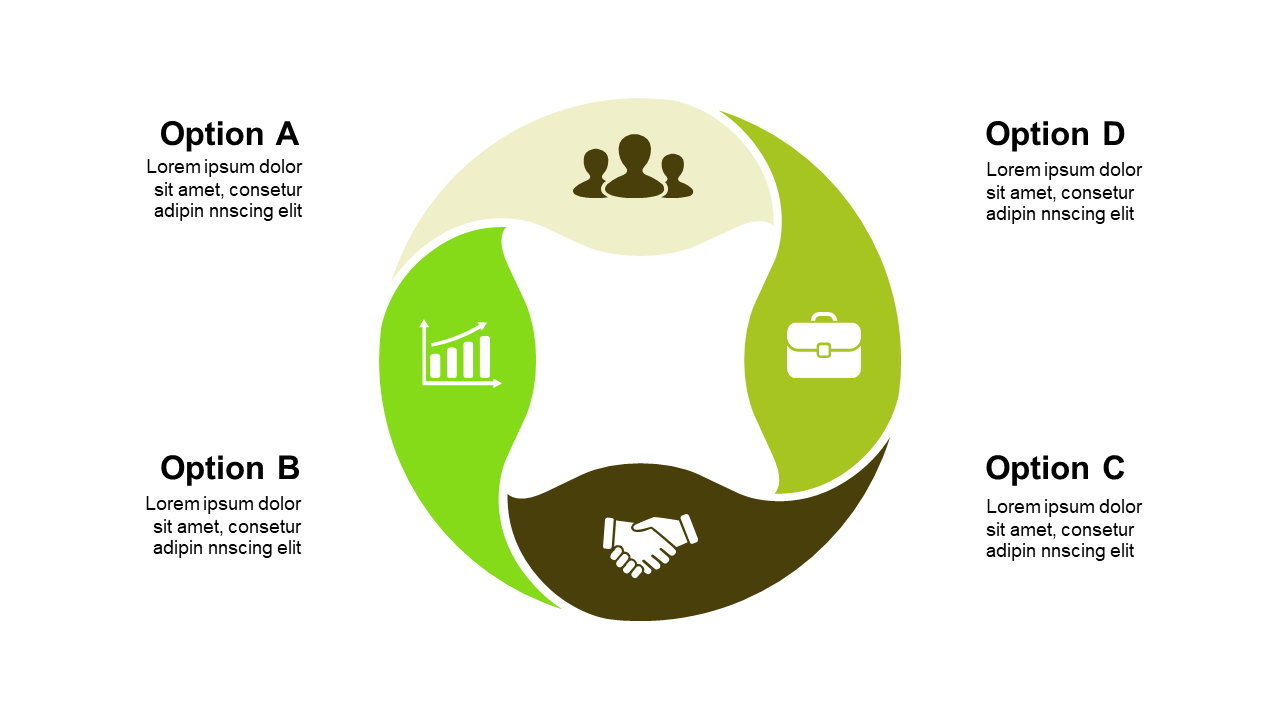
In fast-paced settings, clearly showcasing different phases of a project can become a daunting task. This engaging circular diagram organizes your presentation into six distinct segments, each supported by an illustrative icon to signify the key stages of your workflow.
This slide comes in handy for operations managers needing to showcase project timelines or product development leads presenting phases to their teams. It’s suitable for any meeting where clarity and engagement are essential, whether you’re guiding your team through a project review or reporting to stakeholders.
You can grab this slide for just $0.99, making it an easy addition to your toolkit. It’s instantly downloadable, and you can edit it in PowerPoint or Google Slides to make sure it fits your specific needs right away.
$0.99 – Purchase Checkout
Added to cart







