Illustrate Processes with Hexagonal Steps and Icons
Product Description
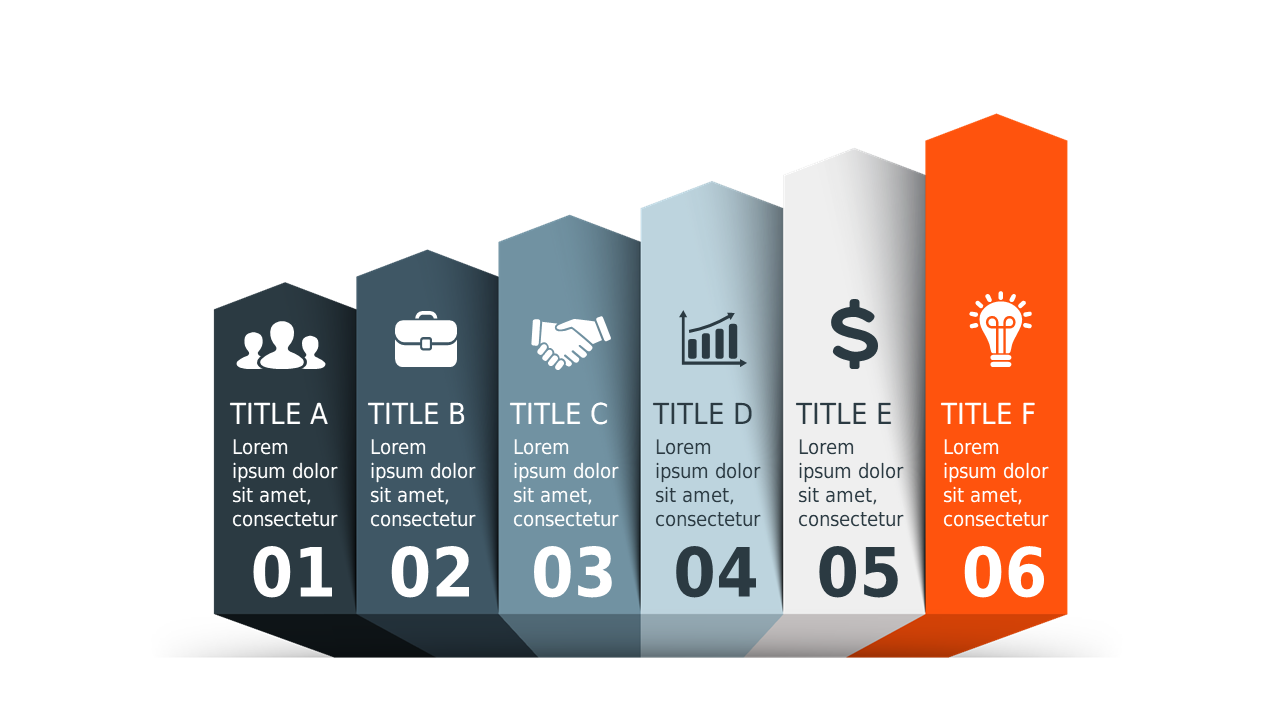
When trying to convey intricate processes, it’s common to overwhelm your audience with too much information or poorly structured visuals. This slide uses hexagonal steps and icons to create a visually engaging representation that simplifies complex ideas. You’ll find that this format not only enhances understanding but also keeps your audience engaged throughout your presentation.
This design is perfect for project managers detailing project phases or business analysts explaining data processes. Consider using it in a team meeting to illustrate workflow improvements or during a client presentation to clarify your methodology.
This slide allows you to communicate effectively without losing the essential details. Available for just $0.99, this slide is ready for instant download and easily editable in both PowerPoint and Google Slides. In just minutes, you can adapt it to your specific needs, ensuring you deliver a compelling presentation.
$0.99 – Purchase Checkout
Added to cart