Present Steps Clearly with Icon-Based Indicators
Product Description
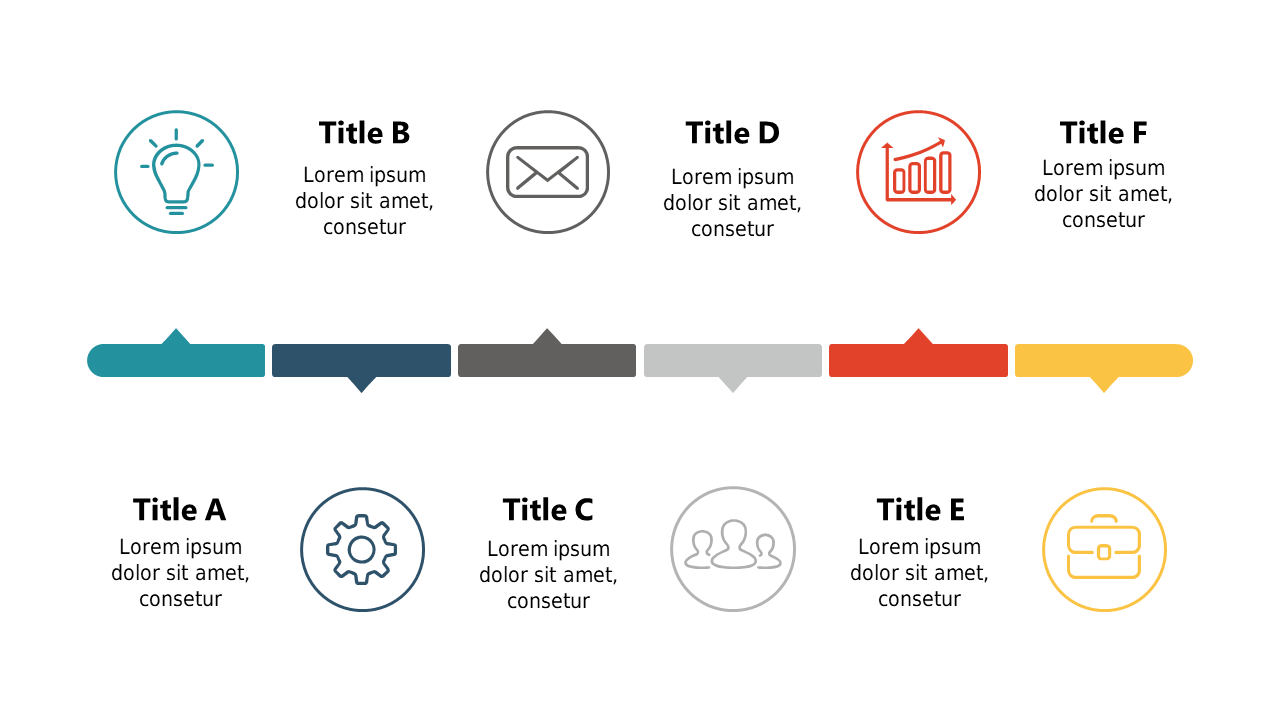
When explaining a multi-step process, keeping your audience engaged and informed can be quite a task. This slide addresses that challenge by using iconic indicators to highlight each stage clearly. The straightforward layout makes it easy to guide your audience through complex information without losing their attention.
You might find this design particularly useful if you’re a team leader walking your group through a new protocol, a training facilitator leading a workshop, or a consultant presenting a step-by-step strategy to clients. It’s made for scenarios where clarity and visual appeal are essential for effective communication.
At just $0.99, this slide is available for immediate download and can be edited in both PowerPoint and Google Slides.
You can customize it quickly, ensuring that your presentation is polished and ready to go before your next meeting.
$0.99 – Purchase Checkout
Added to cart







