Illustrate Workflows with Numbered Steps in PowerPoint
Product Description
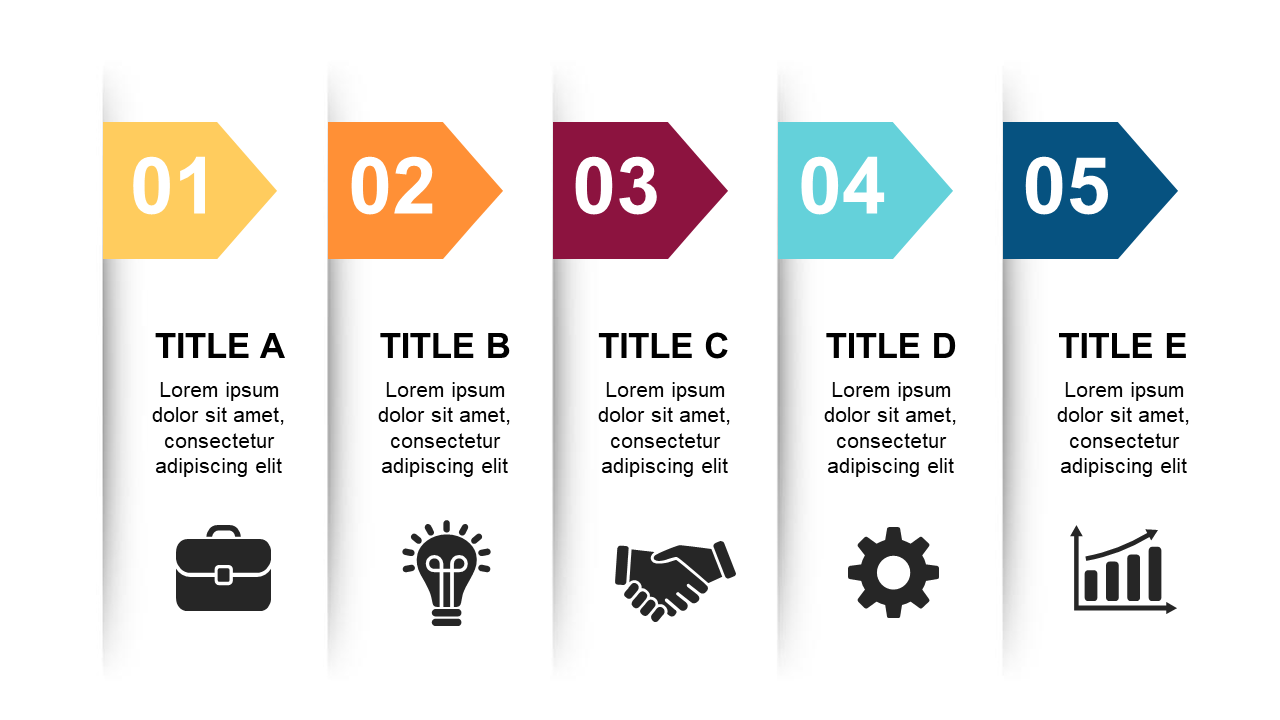
Managing projects often comes with the challenge of conveying intricate processes clearly. Without a straightforward way to illustrate workflows, your team might miss crucial details. This slide provides a visual representation of numbered steps and icons, making it easy for anyone to follow along and understand the flow of tasks.
Project managers explaining timelines or team leaders outlining project stages will appreciate how this slide simplifies complex ideas. Think about utilizing it in a project kickoff meeting to make sure every team member is aligned or during status updates to track progress clearly.
This clarity will help your audience stay engaged and informed. For only $0.99, you can download this slide immediately, and it’s fully editable in both PowerPoint and Google Slides. Make your project communications shine effortlessly with this user-friendly design.
$0.99 – Purchase Checkout
Added to cart







