Outlined Circular Steps for Sequential Processes
Product Description
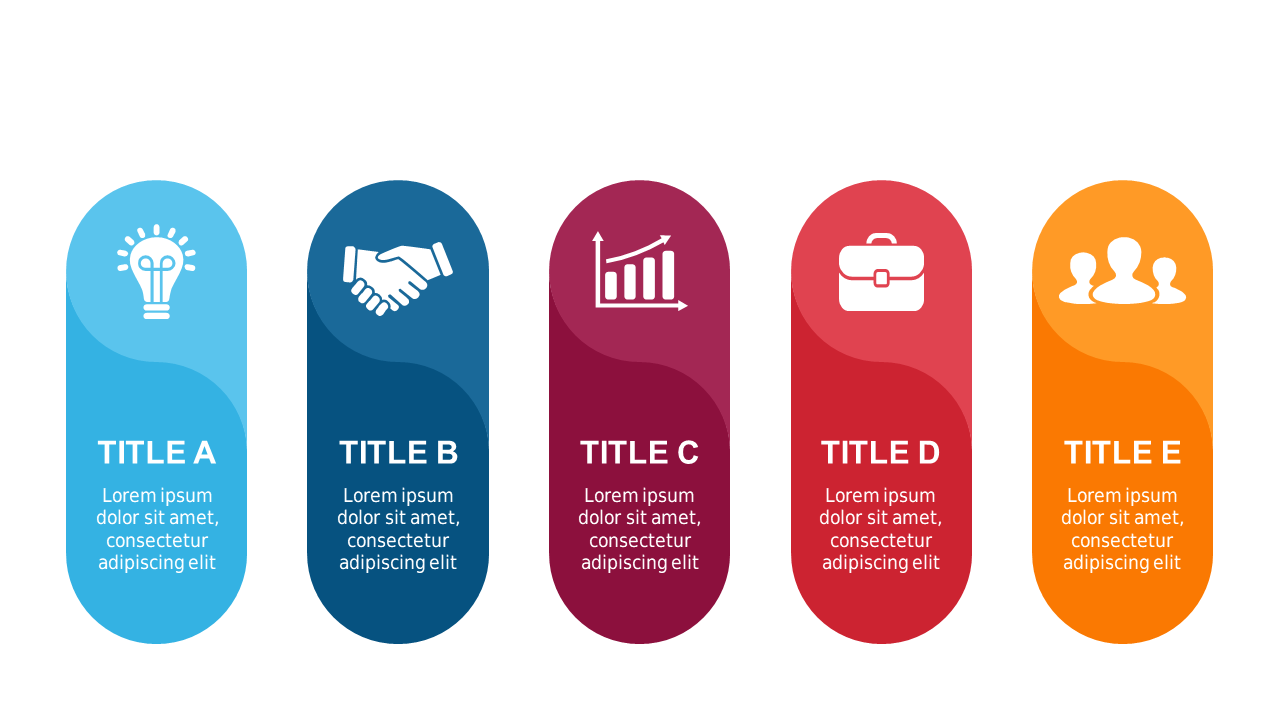
Explaining complex processes doesn’t have to be a headache. This slide’s design, featuring outlined circular steps, makes it engaging and straightforward to follow.
Each colorful rounded pillar represents a distinct phase and is equipped with icons and titles, making the entire process visually appealing and easy to digest. Ideal for trainers and business developers, this slide works wonderfully during workshops or brainstorming sessions. Use it to highlight sequential processes, ensuring that everyone involved understands their part clearly, whether you’re in a corporate environment or a creative agency.
For just $0.99, you can have this slide instantly available for download, and it’s simple to edit in either PowerPoint or Google Slides. Grab it now to enhance your presentations and present your ideas with clarity.
$0.99 – Purchase Checkout
Added to cart







