Colorful Pillar Indicators for Process Clarity
Product Description
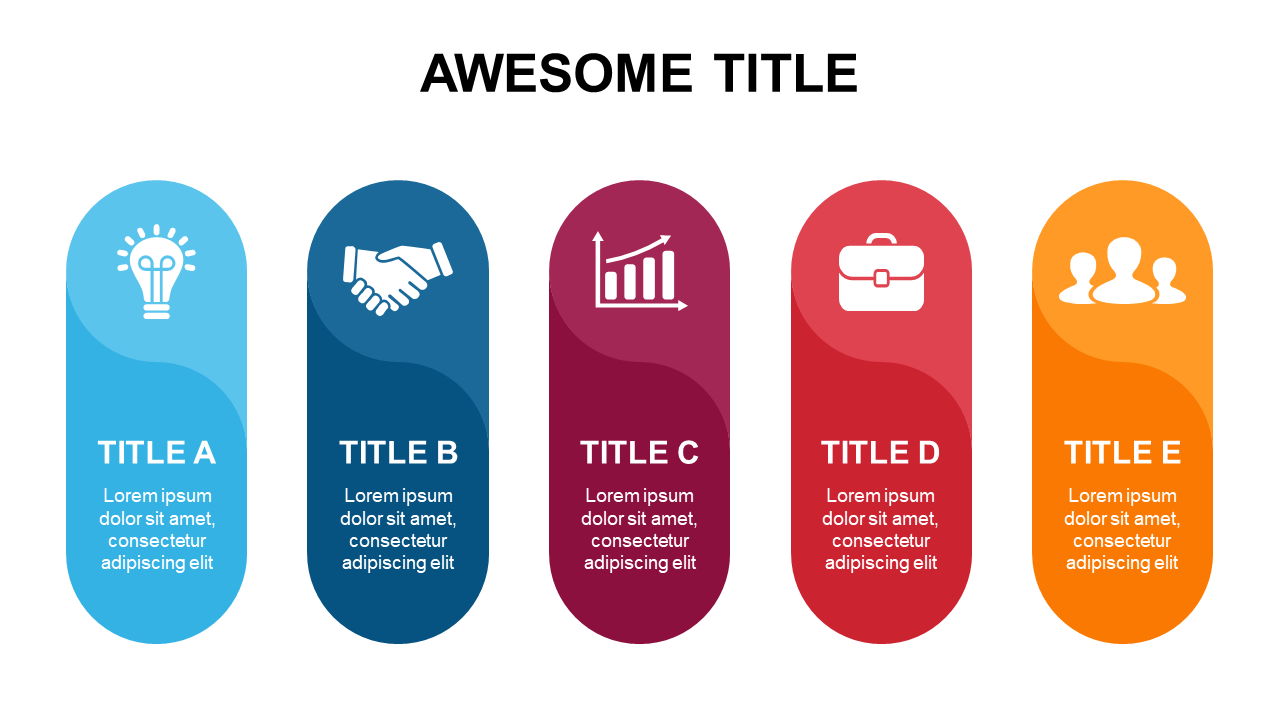
When breaking down a complex process, clarity is essential for effective communication. This slide provides a vibrant visual layout with colorful rounded pillars, each clearly representing different steps.
With icons and titles accompanying each pillar, your audience will find it easy to grasp the flow of your project. This slide is an excellent choice for business analysts and project managers in consulting or finance when presenting process maps or workflows. It’s particularly useful during client meetings or internal reviews to ensure everyone understands the process at hand.
You can grab this slide for only $0.99, and it’s available for instant download. Easily edit it in PowerPoint or Google Slides to fit your needs and elevate your presentations right away.
$0.99 – Purchase Checkout
Added to cart







