Clarify Concepts with a Two-Step Process Flow V2
Product Description
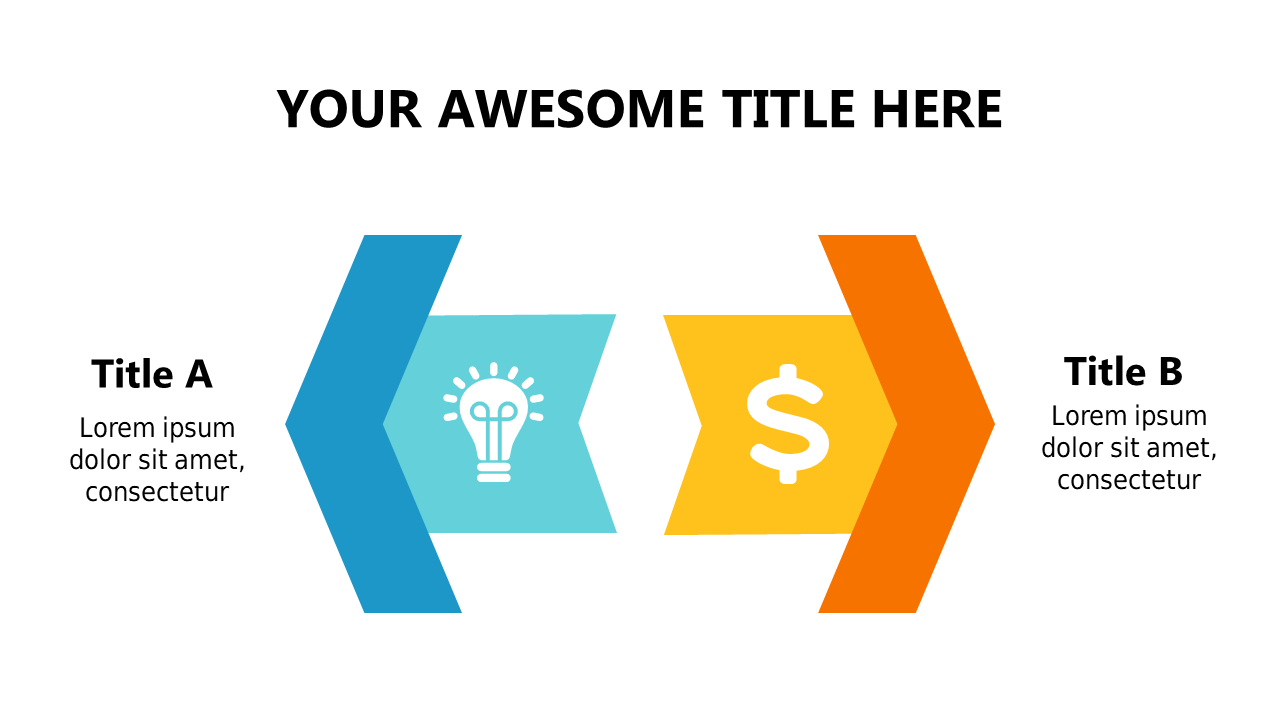
Explaining complex processes can often lead to confusion if not presented clearly. This two-step process flow slide offers a visually engaging way to illustrate transitions, making it easier for your audience to follow along.
With its color-coded arrows and icons, you can differentiate between concepts seamlessly. This slide is particularly useful for consultants presenting strategies, trainers facilitating workshops, or analysts summarizing data findings. Whether you’re in a strategy meeting or delivering a training session, this slide will help you clarify your points and keep your audience focused.
Available for just $0.99, this slide is ready for instant download and customization in PowerPoint and Google Slides. You’ll find it easy to tailor it to your needs and have it ready to present within minutes.
$0.99 – Purchase Checkout
Added to cart







