Present Steps to Success with Circular Indicators
Product Description
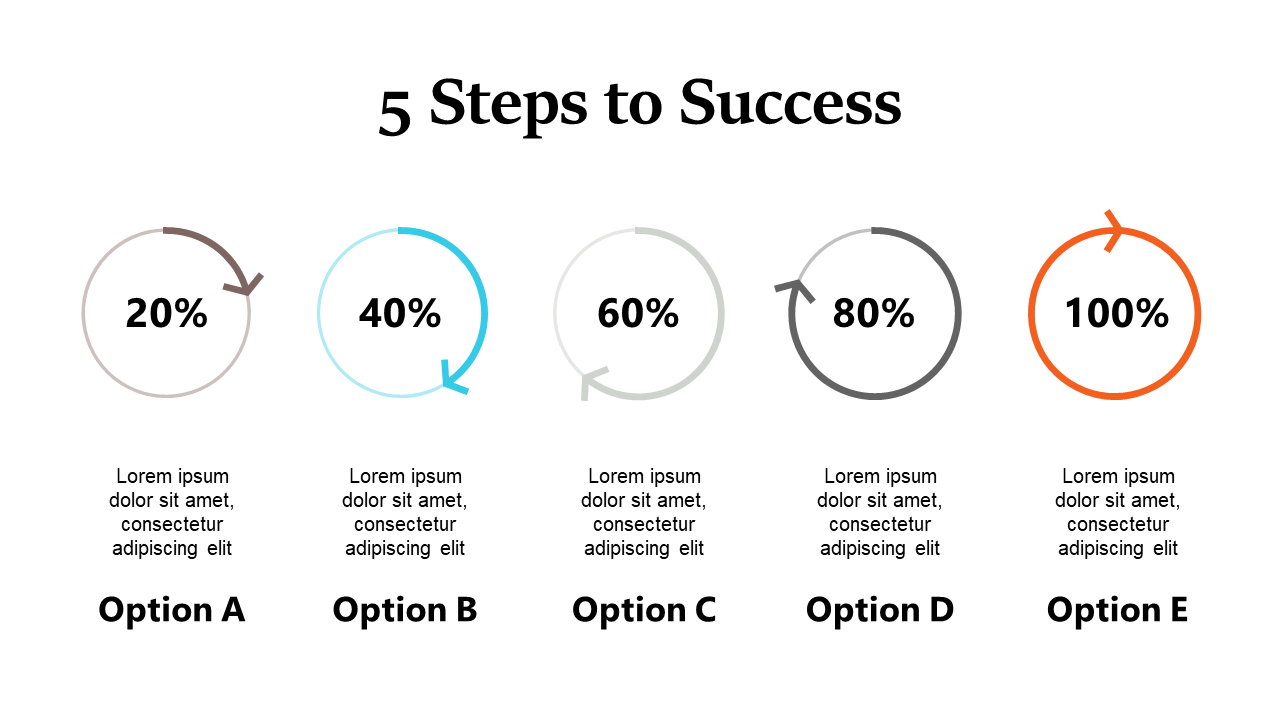
Conveying a clear path to success can often feel like an uphill battle, especially when you’re dealing with intricate processes. You need a way to break down your ideas visually that your audience can easily grasp. This slide features five circular indicators, allowing you to present key steps in a straightforward and engaging manner.
Business analysts, project managers, and team leads will find this slide particularly useful during process reviews or strategy sessions. Use it in meetings to outline project milestones or during training sessions where you need to guide your team through systematic steps.
Whether you’re in tech, finance, or marketing, this slide helps you communicate your ideas effectively. For just $0.99, you can download this slide and start editing it right away. It’s compatible with both PowerPoint and Google Slides, making it easy to customize to fit your needs in just minutes.
$0.99 – Purchase Checkout
Added to cart







