Compare Processes with Dynamic Dual Arrow Layout
Product Description
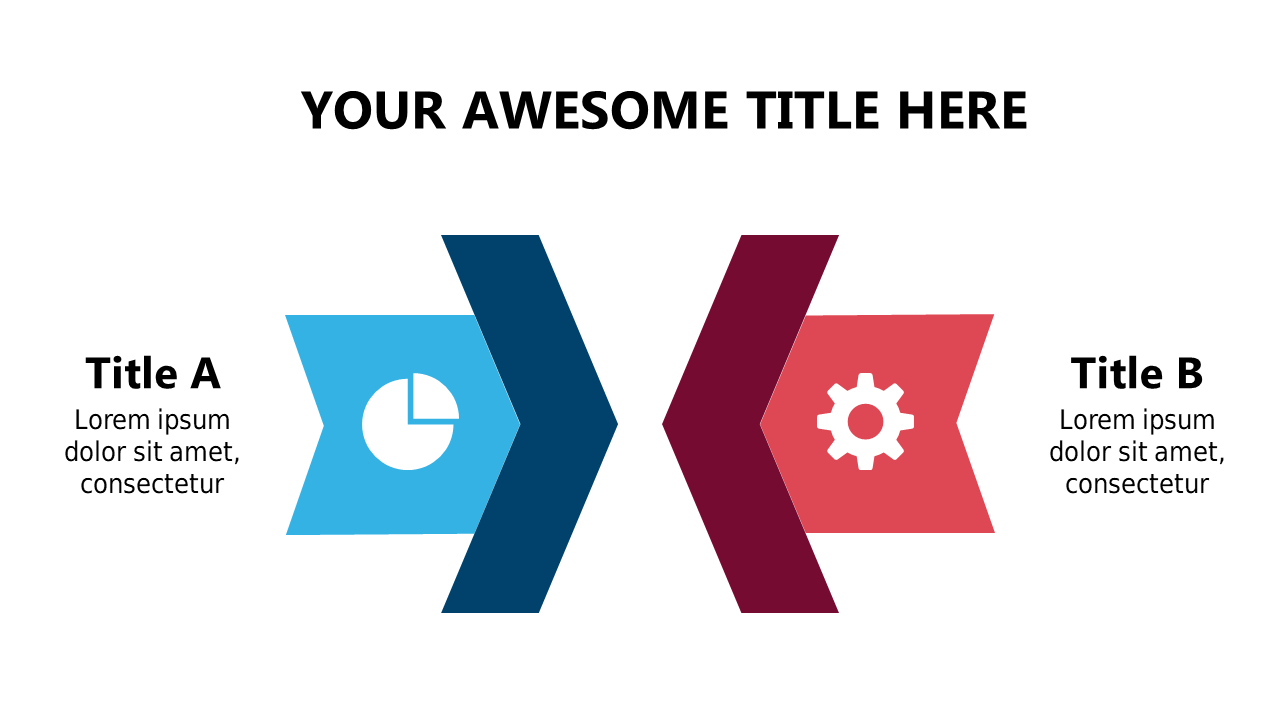
Comparing multiple processes can often lead to confusion among your audience, particularly when details become too intricate. This slide simplifies that challenge with a dynamic dual arrow layout, allowing you to clearly represent various workflows.
It makes complex comparisons digestible and engaging. This slide is ideal for operations managers or consultants who frequently need to compare processes during strategy meetings or project evaluations. Industries like finance, logistics, and technology will find this particularly useful for conveying intricate information clearly and effectively.
For just $0.99, you can download this slide instantly, and it’s fully editable in both PowerPoint and Google Slides. Customize it to fit your presentation style in no time at all.
$0.99 – Purchase Checkout
Added to cart