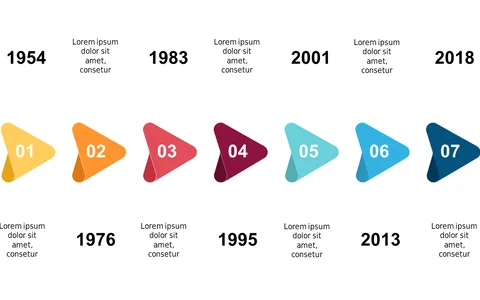
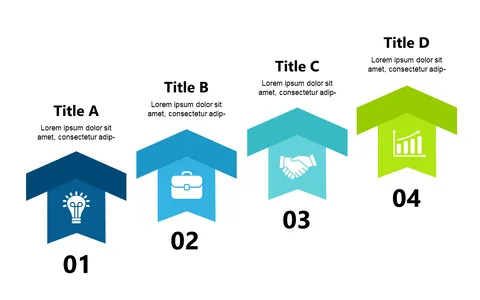
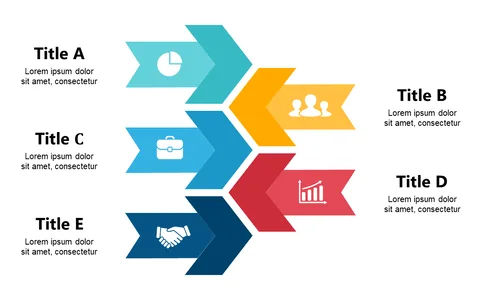
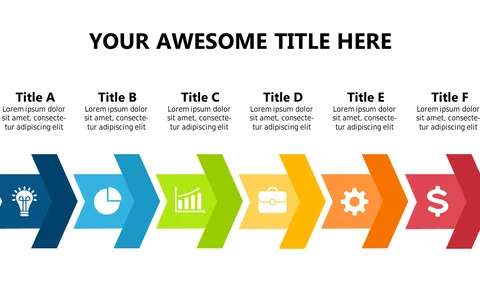
Illustrate Progress with Colorful Arrow Steps
Product Description
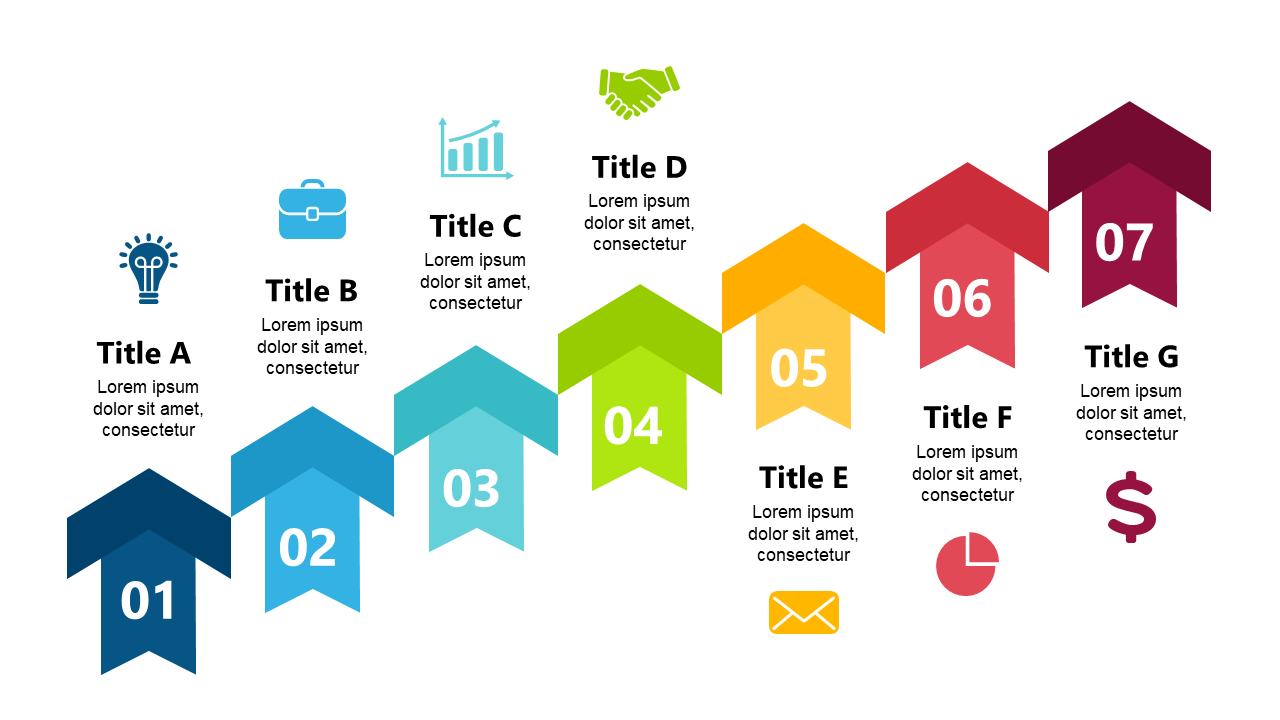
When managing projects, conveying progress can often lead to confusion if not done clearly. This slide provides a straightforward way to display advancement through a series of colorful arrows that guide your audience step by step.
It simplifies complex projects, allowing everyone to see where things stand at a glance. Project managers, team leaders, and analysts can make great use of this slide in weekly updates or client presentations. It’s perfect for illustrating development phases or tracking project timelines, ensuring that your audience understands each step without getting lost in details.
For only $0.99, you can download this engaging slide and edit it quickly in PowerPoint or Google Slides. With just a few clicks, you’ll be ready to deliver a polished presentation that captures your audience’s attention.
$0.99 – Purchase Checkout
Added to cart