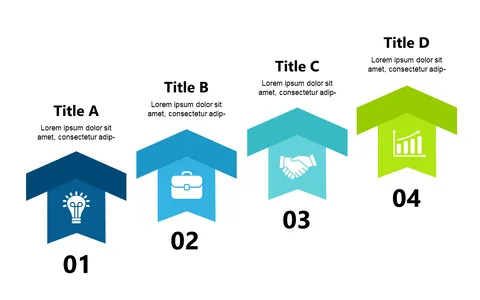
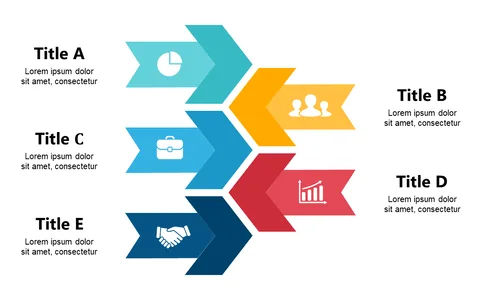
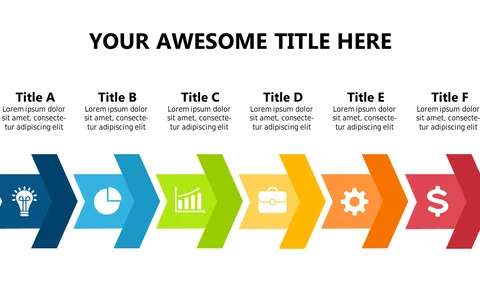
Present Hierarchical Information with Vertical Steps

Product Description
Presenting hierarchical information can become confusing when the details overlap or clutter your message. This slide provides a clean layout of vertical steps so your audience can easily grasp the various phases of your process.
It’s designed to highlight key points without overwhelming viewers. You might find this helpful as a business analyst laying out project stages or an educator explaining curriculum levels.
Team leaders can also use it to clarify roles and responsibilities within a project, ensuring every member understands their place in the workflow. For just $0.99, this slide is immediately available for download and easily editable in PowerPoint and Google Slides, allowing you to tailor it to your specific needs in minutes.
$0.99 – Purchase Checkout
Added to cart