Visual Overlapping Icons for Effective Presentations

Product Description
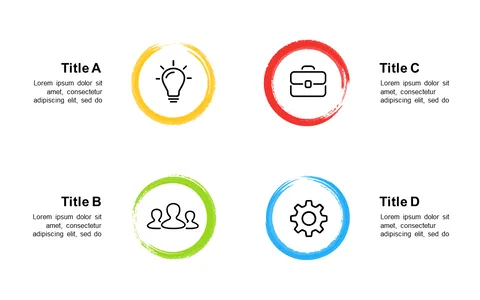
When you’re juggling multiple messages and need a clear way to present them, visual clutter can be a real challenge. This slide, with its overlapping circular shapes and distinct icons, offers a visually engaging solution that keeps your audience focused on your key points.
It’s ideal for consultants delivering project briefs, executives summarizing quarterly results, or educators providing a multi-faceted lesson. With this design, you can effectively manage the complexity of your content while maintaining your audience’s attention.
Available for only $0.99, this slide is a quick and easy addition to your presentation toolkit. You can download it instantly and edit it in both PowerPoint and Google Slides to suit your specific messaging needs.
$0.99 – Purchase Checkout
Added to cart