Present Concepts with Overlapping Icons in Circular Design V2

Product Description
Are you struggling to find a compelling way to present complex concepts? Engaging visuals are key to capturing your audience’s attention and effectively communicating your ideas.
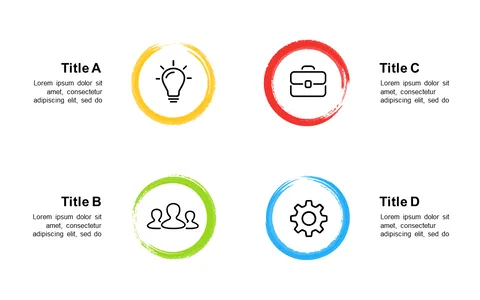
This slide, featuring overlapping circular shapes with distinct icons, simplifies the presentation of intricate information into digestible parts. Ideal for educators explaining multifaceted theories, business analysts reviewing data trends, or product owners mapping out features, this design allows you to bring clarity and interest to your discussions. Whether you’re in a classroom, boardroom, or workshop, you can make your points resonate.
Download this slide now for only $0.99 and see how easy it is to customize for your specific needs. It’s editable in PowerPoint and Google Slides, ensuring you can adapt it quickly for your next presentation.
$0.99 – Purchase Checkout
Added to cart