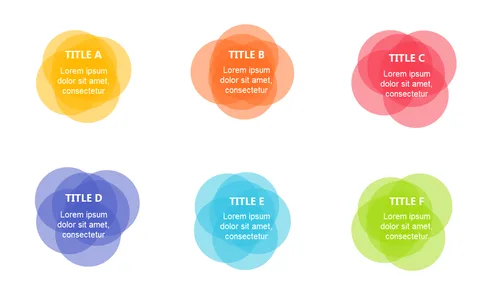
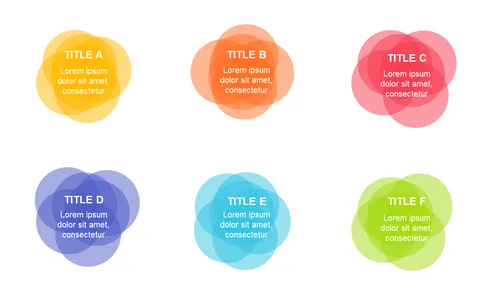
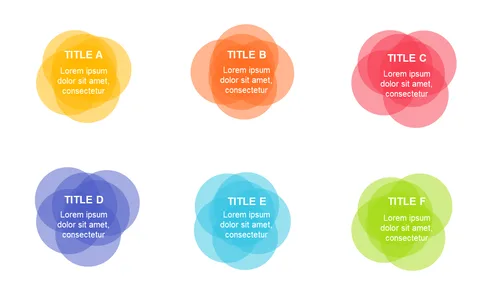
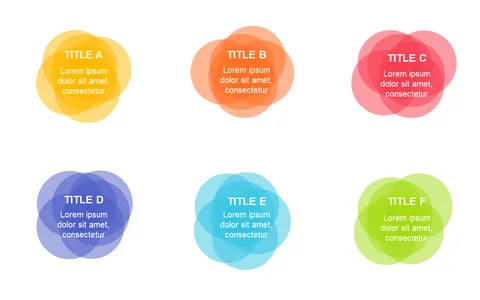
Present Intersecting Ideas with Colorful Venn Diagram V4
Product Description
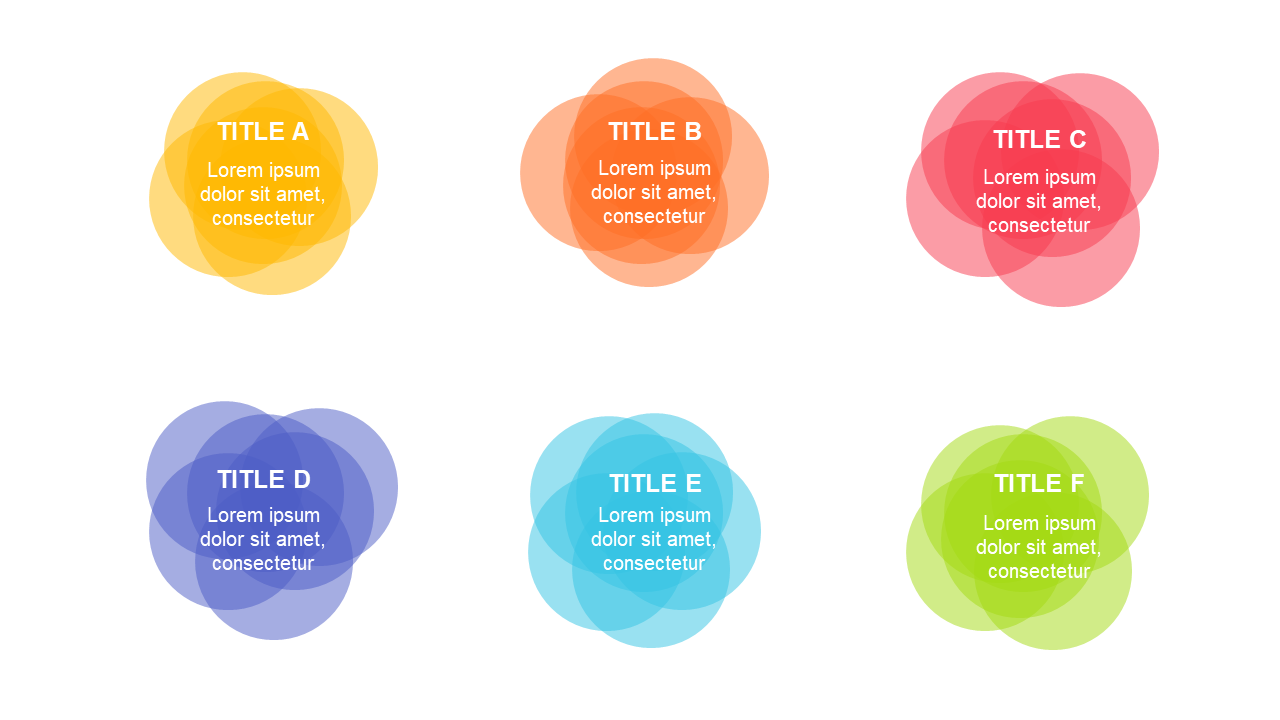
In fast-paced consulting environments, simplifying complex ideas is crucial for maintaining audience engagement. A colorful Venn diagram can help break down overlapping concepts into an easy-to-understand visual, ensuring clarity in your presentations.
Consultants can use this slide in client meetings to illustrate how various strategies interconnect or to highlight the relationship between different market trends. It’s also great for team workshops where brainstorming overlapping ideas is essential for innovation.
For just $0.99, this slide is available for immediate download, making it easy for you to edit and customize in PowerPoint or Google Slides. You’ll have a professional-looking visual at your fingertips in minutes.
$0.99 – Purchase Checkout
Added to cart