Illustrate Success Factors with a Versatile Venn Diagram

Product Description
In today’s fast-paced work environment, clearly presenting complex data is crucial. You may find yourself struggling to communicate key success factors that are intertwined.
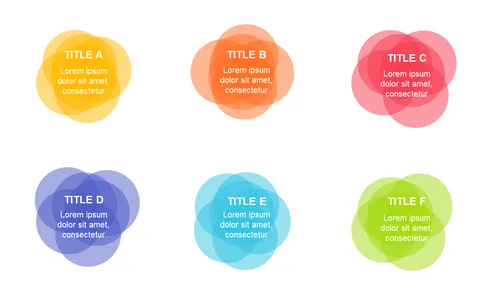
This versatile Venn diagram simplifies these concepts, showcasing elements like mission, values, and team dynamics to make your point effectively. Business analysts during project evaluations, marketers outlining campaign strategies, or educators summarizing course objectives will all benefit from this slide. It’s an excellent choice for anyone needing to illustrate how different components work together for success.
Available for just $0.99, this slide is ready for instant download and easily editable in PowerPoint or Google Slides. You can quickly customize it to fit your specific needs and prepare for your next presentation.
$0.99 – Purchase Checkout
Added to cart