Showcase Business Concepts with Colorful Icons

Product Description
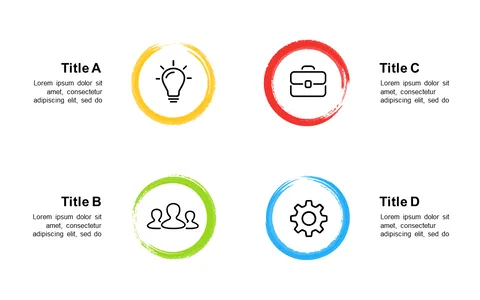
Grabbing your audience’s attention in a crowded room can be tough, especially when you need to explain complex business ideas. If you’re missing that visual hook, this slide is your answer.
With eye-catching colorful circular icons, it makes illustrating themes like teamwork and finance both engaging and easy to understand. This slide is particularly useful for business analysts presenting quarterly reviews or sales leaders demonstrating their strategies to clients. Using vibrant visuals allows you to break down complicated concepts into digestible parts, ensuring your audience stays focused on your key points.
At an affordable price of $0.99, you can download this slide instantly and edit it in both PowerPoint and Google Slides. It’s designed for quick customization, helping you present your ideas with clarity and style in no time.
$0.99 – Purchase Checkout
Added to cart