Optimize Strategy with 5-Section Value Chain Matrix
Product Description
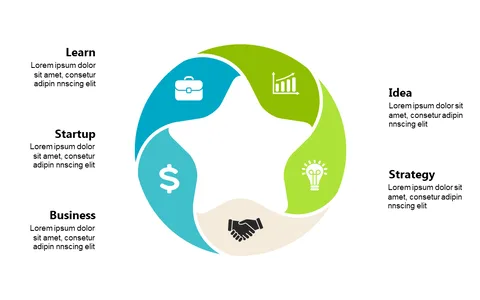
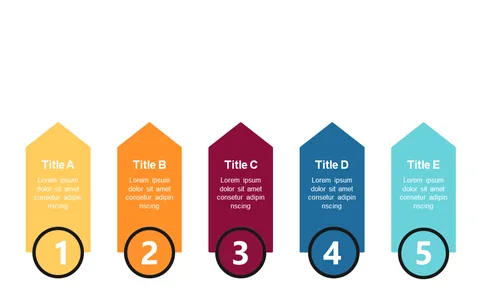
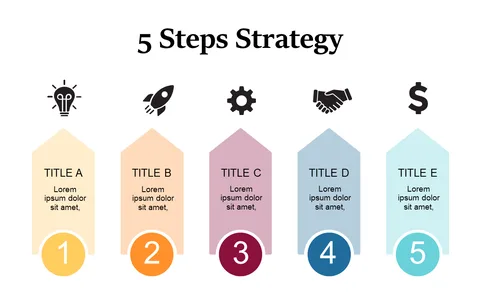
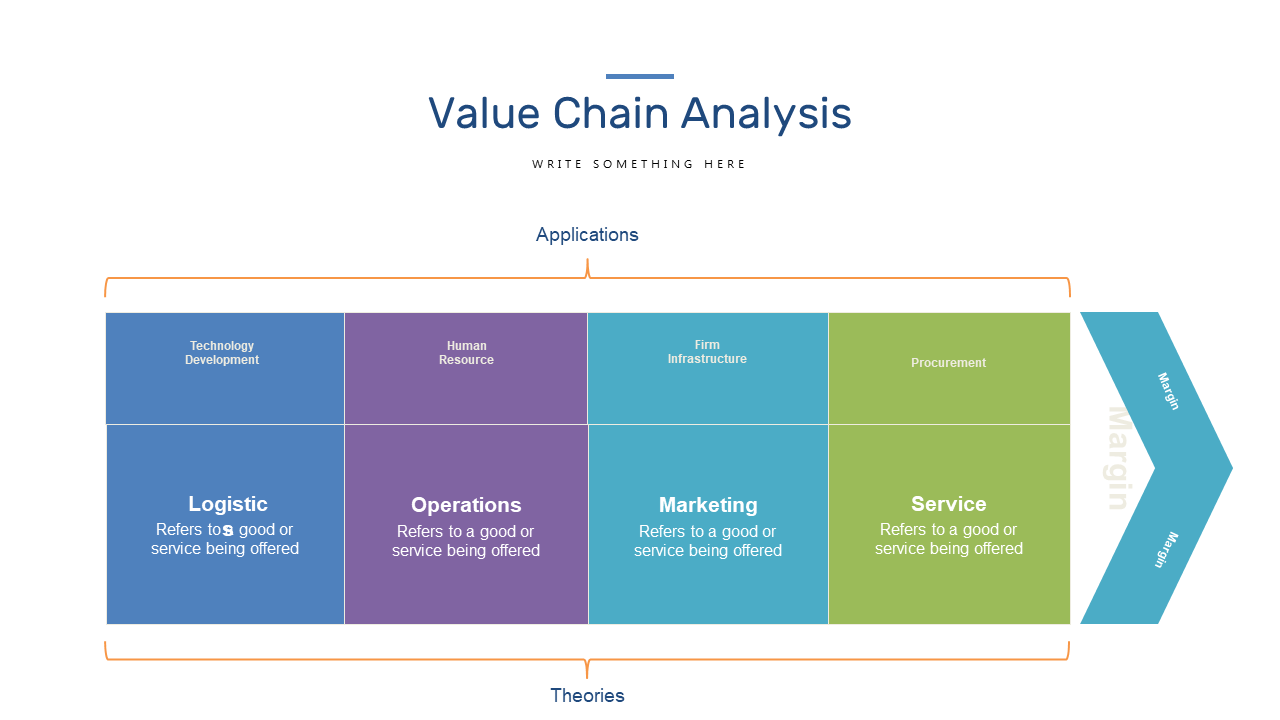
Presenting complex data in a digestible format can be tough, especially when analyzing your organization’s operations. This slide features a 5-section value chain matrix that allows you to break down crucial components visually, making your analysis easier to follow and understand.
This slide is a great asset for operations managers, strategy consultants, and business analysts who are tasked with presenting data in team meetings, strategic planning sessions, or client consultations. It’s an excellent way to showcase logistics, marketing, or any other key operational areas that require attention.
At just $0.99, you can download this slide instantly, and it’s fully editable in both PowerPoint and Google Slides. Make a powerful impression with a clean, organized presentation that highlights your findings.
$0.99 – Purchase Checkout
Added to cart