Detail Value Chain Analysis for Competitive Advantage

Product Description
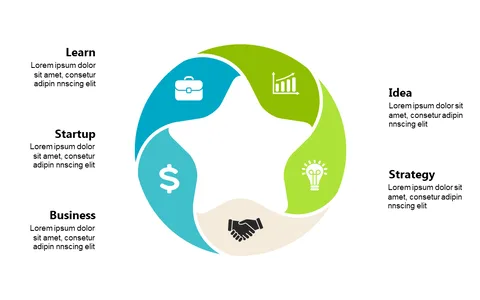
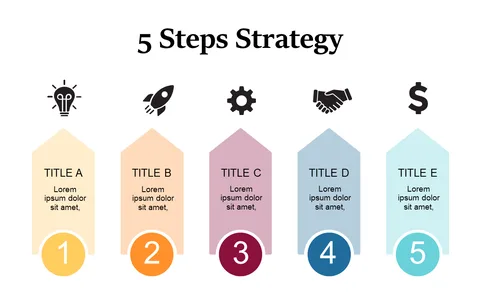
When the goal is to illustrate how a company creates value, a clear visual representation can make all the difference. This slide dissects the Value Chain Analysis into clearly defined sections for logistics, operations, marketing, and service, helping your audience to quickly grasp the components at play. The straightforward layout invites engagement and enhances understanding.
Suitable for business development executives and strategy consultants, this slide is perfect for analyses presented to clients or internal teams. It’s also a solid choice for financial analysts who need to present reports on operational efficiency and value creation.
The clarity it provides allows professionals in various roles to present their insights effectively. At just $0.99, this slide is ready for instant download and can be easily edited in PowerPoint or Google Slides. You’ll have it set up in no time, ready to impress your audience with your well-structured presentation.
$0.99 – Purchase Checkout
Added to cart