Visualize Stakeholder Relationships with Venn Diagram
Product Description
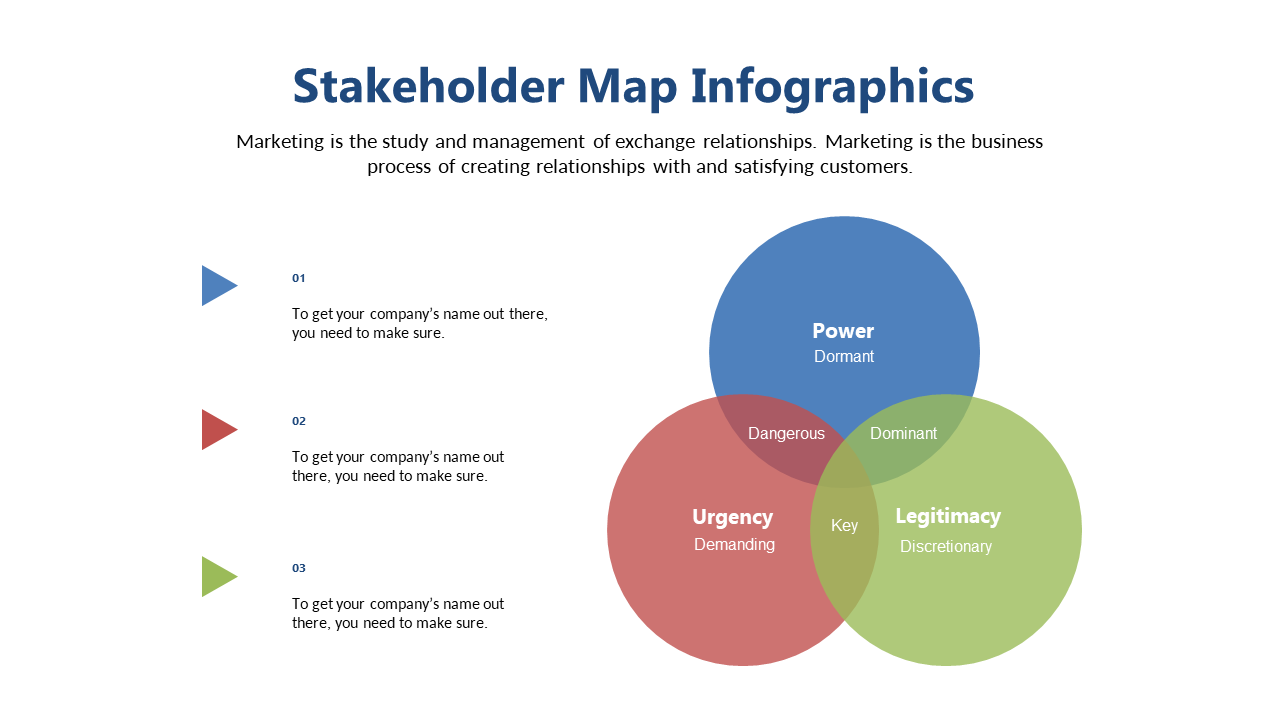
Understanding who holds power and urgency in complex projects can be daunting. This Venn diagram slide clarifies stakeholder relationships by highlighting the intersections of their roles, helping you communicate effectively about their positions.
Project managers, consultants, or product leads can use this slide during strategy sessions, team briefings, or stakeholder presentations to clarify the dynamics at play. It’s an ideal tool for anyone needing to navigate the complexities of collaboration in industries like tech, finance, or healthcare.
At just $0.99, this slide is available for instant download and is fully editable in PowerPoint or Google Slides. You can enhance your presentation with minimal effort and make a lasting impression.
$0.99 – Purchase Checkout
Added to cart







