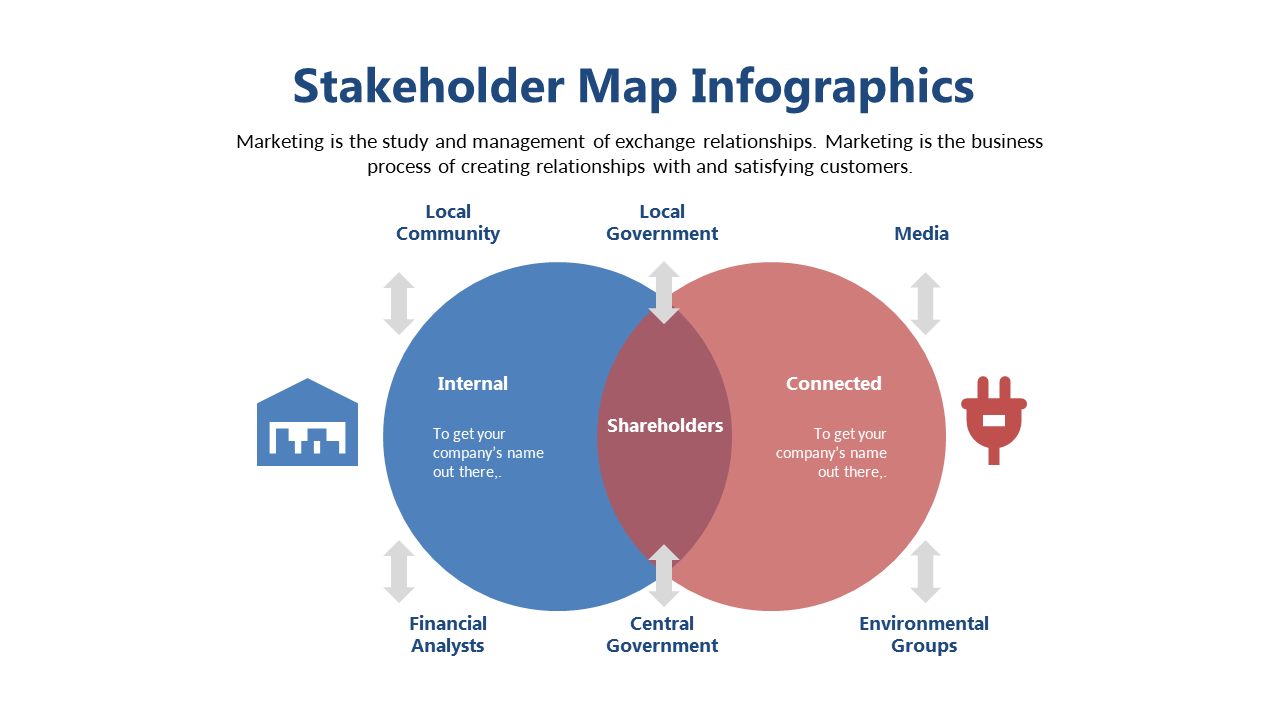
Showcase Stakeholder Relationships with Venn Diagram
Product Description
Creating a clear representation of stakeholder relationships can be tricky, especially when trying to show how different parties interact. This Venn diagram allows you to visualize those intricate connections, making it simple for your audience to grasp the overlaps at a glance.
This slide is perfect for marketing strategists developing campaign proposals, project managers coordinating with different teams, or business analysts presenting findings to executives. You might find it especially useful during stakeholder meetings where clarity is essential to making informed decisions.
For just $0.99, you can download this slide instantly and customize it easily in either PowerPoint or Google Slides. Make your presentations more effective without spending hours on design.
$0.99 – Purchase Checkout
Added to cart







