Illustrate Stakeholder Levels with Diamond Diagram
Product Description
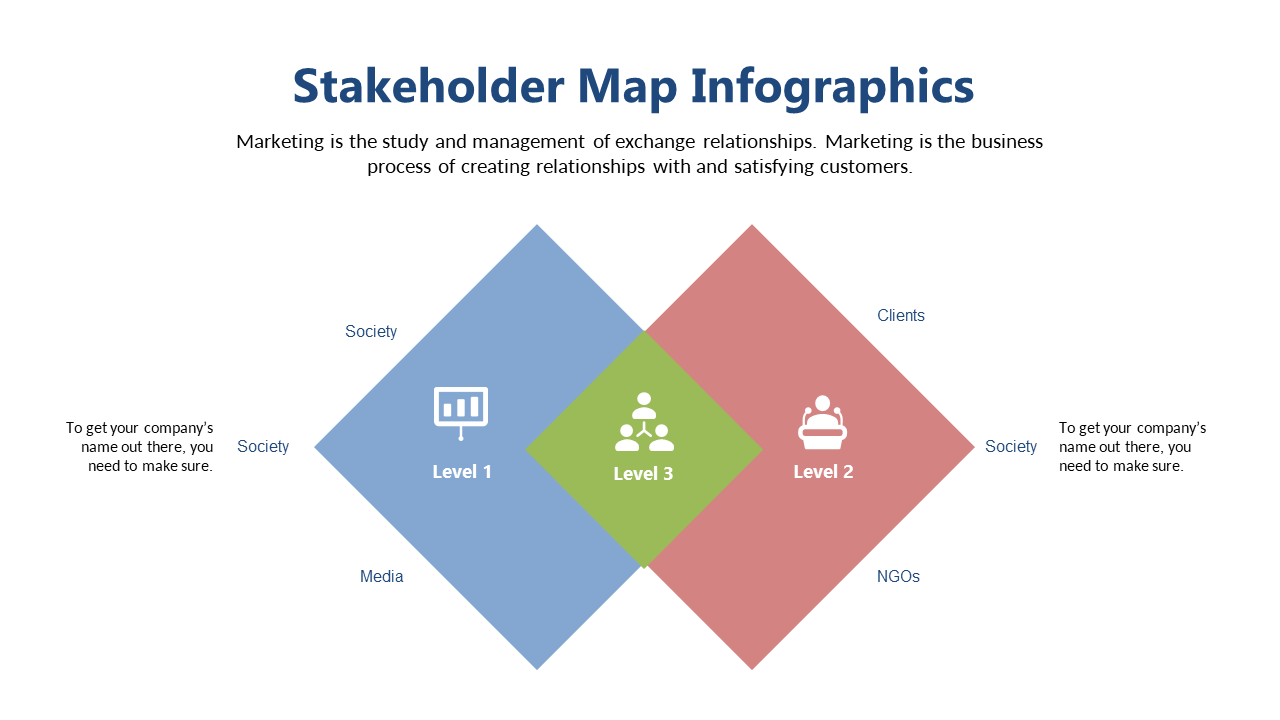
When juggling different stakeholder interests, it’s important to clearly differentiate who falls into which category. This diamond diagram provides a straightforward way to depict various stakeholder levels so that your audience can clearly understand their significance in your project.
Operations managers and project leads will appreciate this slide during team reviews or project kick-off meetings, where it’s essential to outline stakeholders’ roles and expectations. By visually categorizing stakeholders, you can foster better communication and collaboration within your team.
For only $0.99, this slide is ready for instant download and easy editing in PowerPoint and Google Slides. You can quickly adapt the visual to meet your specific needs, making it a simple addition to your toolkit in no time.
$0.99 – Purchase Checkout
Added to cart







