Present Value Pricing with Cyclical Diagram
Product Description
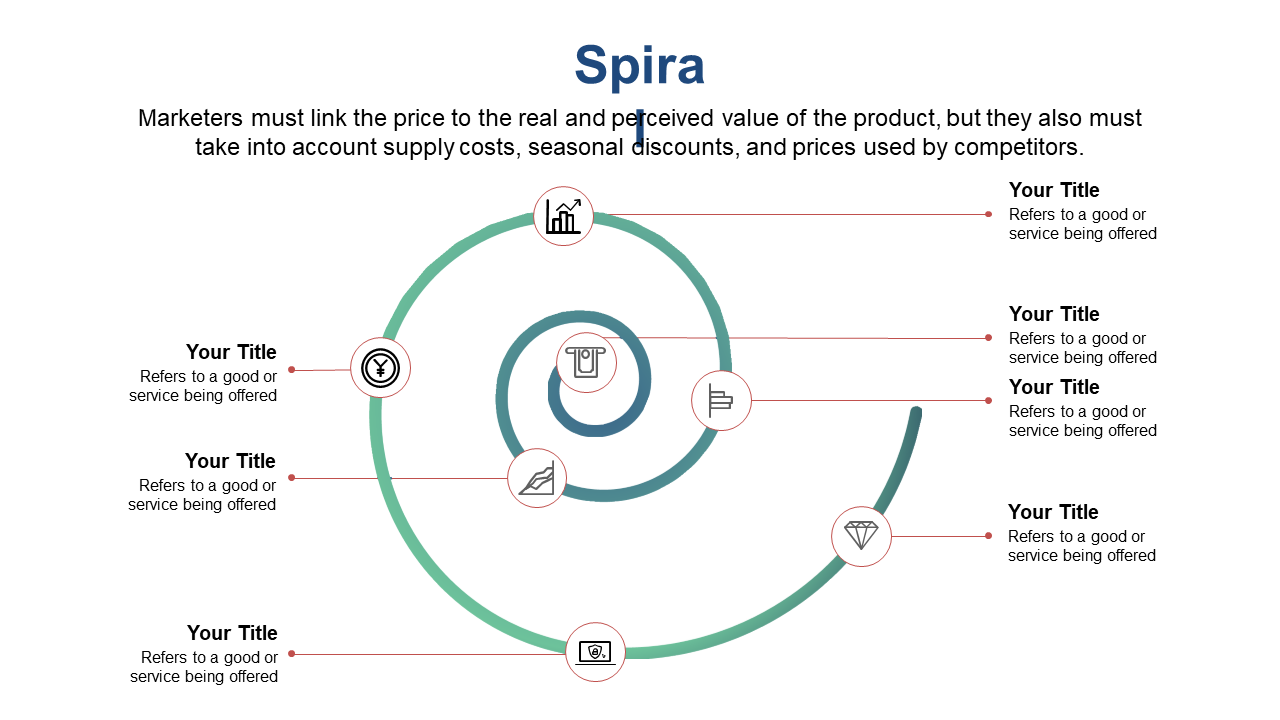
Navigating pricing complexities can be a daunting challenge, especially for brand strategists eager to link real and perceived value. This slide makes that task easier with a cyclical diagram that visually represents the nuances of value pricing strategies, ensuring your audience understands the connections clearly.
Whether you’re a brand manager pitching to potential partners or a pricing analyst crafting a report for executive leadership, this slide is vital in effectively conveying your pricing strategy. It breaks down complex ideas into digestible visuals that facilitate understanding and discussion.
For only $0.99, this slide is ready for instant download and is fully editable in PowerPoint and Google Slides. Customize it to fit your presentation style and deliver your value pricing strategy with confidence.
$0.99 – Purchase Checkout
Added to cart







