Customize Pricing Strategies with Spiral Diagram
Product Description
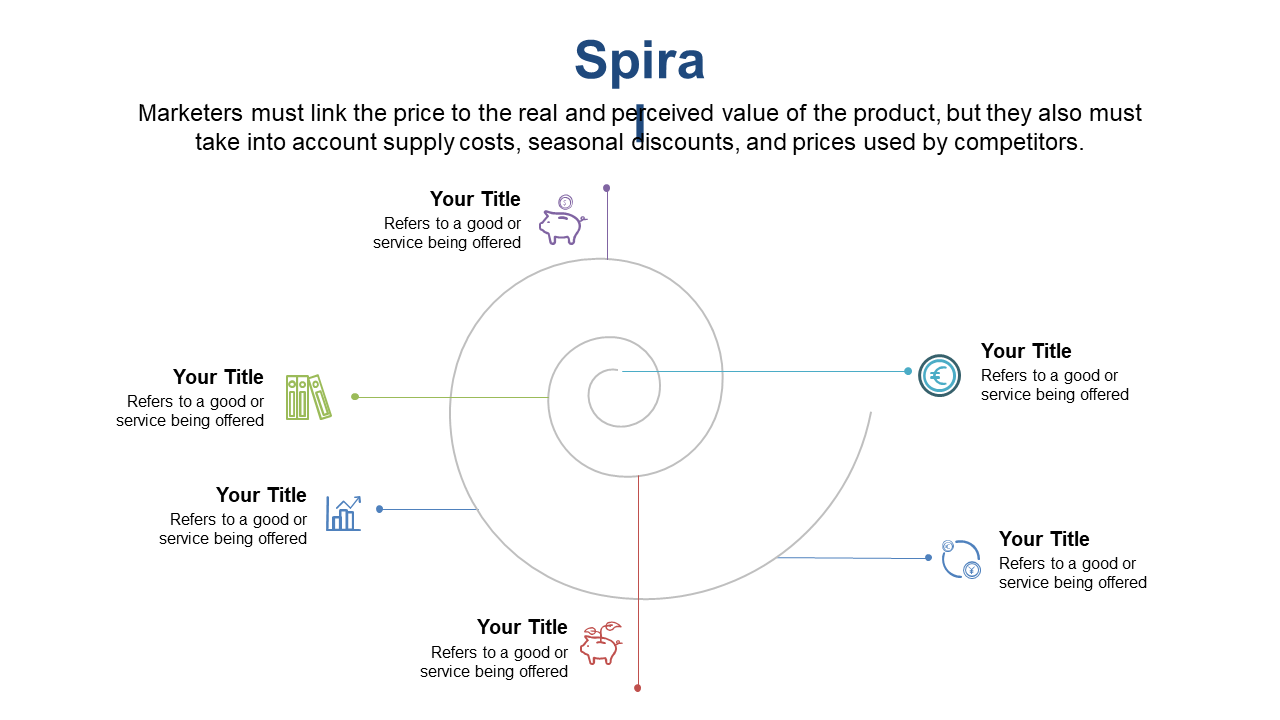
Conveying complex pricing strategies can be daunting, especially when you want your audience to understand the relationship between perceived and actual prices. This spiral diagram simplifies that narrative, allowing you to illustrate these connections effectively.
Use this slide in marketing strategy sessions, finance meetings, or when presenting to clients about pricing adjustments. It’s perfect for marketing managers, financial analysts, or business consultants looking to clarify their strategies.
Download this slide for just $0.99 today, and you’ll be ready to customize it in PowerPoint or Google Slides in no time. It’s designed for easy editing, ensuring you can present your ideas clearly and confidently.
$0.99 – Purchase Checkout
Added to cart







